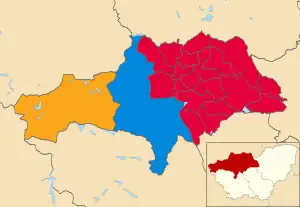
Map showing the results of the 2018 Barnsley Metropolitan Borough Council election
The 2018 Barnsley Metropolitan Borough Council election took place on 3 May 2018 to elect members of Barnsley Metropolitan Borough Council in England.[1] This was on the same day as other local elections.
Result
| Barnsley Metropolitan Borough Council election results | |||||||||||||||
|---|---|---|---|---|---|---|---|---|---|---|---|---|---|---|---|
| Party | Candidates | Votes | |||||||||||||
| Stood | Elected | Gained | Unseated | Net | % of total | % | No. | Net % | |||||||
| Labour | 21 | 19 | 2 | 1 | 90.4 | 58.9 | 26,151 | ||||||||
| Conservative | 21 | 1 | 0 | 0 | 4.7 | 18.1 | 8,068 | ||||||||
| Liberal Democrats | 14 | 1 | 1 | 0 | 4.7 | 9.8 | 4,380 | New | |||||||
| Green | 9 | 0 | 0 | 0 | 0.0 | 3.8 | 1,695 | ||||||||
| Barnsley Ind. | 2 | 0 | 0 | 2 | 0.0 | 3.2 | 1,454 | ||||||||
| Independent | 2 | 0 | 0 | 0 | 0.0 | 1.9 | 857 | ||||||||
| Democrats and Veterans | 3 | 0 | 0 | 0 | 0.0 | 1.7 | 771 | New | |||||||
| Yorkshire | 2 | 0 | 0 | 0 | 0.0 | 1.7 | 754 | ||||||||
| English Democrat | 1 | 0 | 0 | 0 | 0.0 | 0.5 | 235 | ||||||||
| Totals | 93 | 21 | 100.0 | 100.0 | 44,365 | ||||||||||
Candidates
Central ward
| Party | Candidate | Votes | % | ±% | |
|---|---|---|---|---|---|
| Labour | Margaret Bruff | 1,285 | 68.0 | ||
| Conservative | Adrian Thompson | 324 | 17.2 | ||
| Green | Rene Van Buuren | 182 | 9.6 | ||
| Liberal Democrats | Connor Audsley | 98 | 5.2 | N/A | |
| Majority | 961 | 50.8 | |||
| Labour hold | Swing | ||||
Cudworth ward
| Party | Candidate | Votes | % | ±% | |
|---|---|---|---|---|---|
| Labour | Joe Hayward | 1,252 | 74.7 | ||
| Conservative | Samuel Wilkinson | 175 | 10.4 | ||
| Yorkshire | Chris Burrows | 161 | 9.6 | ||
| Liberal Democrats | Elizabeth Waters | 50 | 3.0 | N/A | |
| Democrats and Veterans | Gavin Felton | 38 | 2.3 | N/A | |
| Majority | 1,077 | 64.3 | |||
| Labour hold | Swing | ||||
Darfield ward
| Party | Candidate | Votes | % | ±% | |
|---|---|---|---|---|---|
| Labour | Pauline Markham | 1,134 | 57.3 | ||
| Democrats and Veterans | Trevor Smith | 391 | 19.7 | N/A | |
| Conservative | Delia Weldon | 295 | 14.9 | ||
| Liberal Democrats | Kim Boon | 160 | 8.1 | N/A | |
| Majority | 743 | 37.6 | |||
| Labour hold | Swing | ||||
Darton East ward
| Party | Candidate | Votes | % | ±% | |
|---|---|---|---|---|---|
| Labour | Harry Spence | 1,523 | 63.6 | ||
| Conservative | George Hill | 455 | 19.0 | ||
| Liberal Democrats | Steve Hunt | 415 | 17.4 | N/A | |
| Majority | 1,068 | 44.6 | |||
| Labour hold | Swing | ||||
Darton West ward
| Party | Candidate | Votes | % | ±% | |
|---|---|---|---|---|---|
| Labour | Sharon Howard | 1,279 | 55.2 | ||
| Conservative | Lee Ogden | 581 | 25.1 | ||
| Green | Tom Heyes | 324 | 14.0 | N/A | |
| Liberal Democrats | Andrew Waters | 132 | 5.7 | N/A | |
| Majority | 698 | 30.1 | |||
| Labour hold | Swing | ||||
Dearne North ward
| Party | Candidate | Votes | % | ±% | |
|---|---|---|---|---|---|
| Labour | Annette Gollick | 1,107 | 80.2 | ||
| Conservative | Joseph Farnfield | 273 | 19.8 | ||
| Majority | 834 | 60.4 | |||
| Labour hold | Swing | ||||
Dearne South ward
| Party | Candidate | Votes | % | ±% | |
|---|---|---|---|---|---|
| Labour | May Noble | 1,415 | 74.8 | ||
| Conservative | Sharon Jackson | 292 | 15.4 | ||
| Green | Sara Lewis | 184 | 9.8 | N/A | |
| Majority | 1,123 | 59.4 | |||
| Labour hold | Swing | ||||
Dodworth ward
| Party | Candidate | Votes | % | ±% | |
|---|---|---|---|---|---|
| Labour | Neil Wright | 956 | 37.8 | ||
| Barnsley Ind. | Jack Carr | 933 | 36.9 | ||
| Conservative | Debbie Toon | 476 | 18.8 | ||
| Liberal Democrats | Susan Waters | 164 | 6.5 | N/A | |
| Majority | 23 | 0.9 | |||
| Labour gain from Barnsley Ind. | Swing | ||||
Hoyland Milton ward
| Party | Candidate | Votes | % | ±% | |
|---|---|---|---|---|---|
| Labour | Robin Franklin | 1,548 | 71.7 | ||
| Conservative | Michael Payne | 356 | 16.5 | ||
| Liberal Democrats | Glenn Lawrence | 255 | 11.8 | N/A | |
| Majority | 1,192 | 55.2 | |||
| Labour hold | Swing | ||||
Kingstone ward
| Party | Candidate | Votes | % | ±% | |
|---|---|---|---|---|---|
| Labour | Kath Mitchell | 1,078 | 63.3 | ||
| Liberal Democrats | John Ellis-Maurant | 423 | 24.8 | N/A | |
| Conservative | Lesley Watkinson | 202 | 11.9 | ||
| Majority | 655 | 38.5 | |||
| Labour hold | Swing | ||||
Monk Bretton ward
| Party | Candidate | Votes | % | ±% | |
|---|---|---|---|---|---|
| Labour | Kenneth Richardson | 1,279 | 62.3 | ||
| Democrats and Veterans | Vicky Felton | 342 | 16.7 | N/A | |
| Conservative | Adam Bromfield | 250 | 12.2 | ||
| Green | Dean Todd | 119 | 5.8 | N/A | |
| Liberal Democrats | Susan Rose | 63 | 3.0 | N/A | |
| Majority | 937 | 45.6 | |||
| Labour hold | Swing | ||||
North East ward
| Party | Candidate | Votes | % | ±% | |
|---|---|---|---|---|---|
| Labour | Dorothy Higginbottom | 1,397 | 64.4 | ||
| Yorkshire | Tony Devoy | 593 | 27.3 | ||
| Conservative | Elizabeth Hill | 179 | 8.3 | ||
| Majority | 804 | 37.1 | |||
| Labour hold | Swing | ||||
Old Town ward
| Party | Candidate | Votes | % | ±% | |
|---|---|---|---|---|---|
| Labour | Clive Pickering | 1,206 | 54.8 | ||
| Independent | Mark Houchin | 493 | 22.4 | N/A | |
| Conservative | Clive Watkinson | 334 | 15.2 | ||
| Liberal Democrats | Kevin Bennett | 166 | 7.6 | N/A | |
| Majority | 713 | 32.4 | |||
| Labour gain from Barnsley Ind. | Swing | ||||
Penistone East ward
| Party | Candidate | Votes | % | ±% | |
|---|---|---|---|---|---|
| Conservative | Robert Barnard | 1,813 | 50.5 | ||
| Labour | Martin Flack | 1,189 | 33.1 | ||
| Liberal Democrats | David Greenhough | 332 | 9.3 | N/A | |
| Green | Kate Raynor | 255 | 7.1 | ||
| Majority | 624 | 17.4 | |||
| Conservative hold | Swing | ||||
Penistone West ward
| Party | Candidate | Votes | % | ±% | |
|---|---|---|---|---|---|
| Liberal Democrats | Hannah Kitching | 1,741 | 46.5 | N/A | |
| Labour | Jo Newing | 963 | 25.7 | ||
| Conservative | Alex Wilkinson | 840 | 22.4 | ||
| Green | Richard Trotman | 204 | 5.4 | ||
| Majority | 778 | 20.8 | |||
| Liberal Democrats gain from Labour | Swing | ||||
Rockingham ward
| Party | Candidate | Votes | % | ±% | |
|---|---|---|---|---|---|
| Labour | James Andrews | 1,242 | 58.7 | ||
| Conservative | Michael Davies | 524 | 24.8 | ||
| English Democrat | Kevin Riddiough | 235 | 11.1 | ||
| Liberal Democrats | Paul Nugent | 115 | 5.4 | N/A | |
| Majority | 718 | 33.9 | |||
| Labour hold | Swing | ||||
Royston ward
| Party | Candidate | Votes | % | ±% | |
|---|---|---|---|---|---|
| Labour | Tim Cheetham | 1,315 | 69.1 | ||
| Independent | Edward Gouthwaite | 364 | 19.1 | ||
| Conservative | Michael Toon | 224 | 11.8 | ||
| Majority | 951 | 50.0 | |||
| Labour hold | Swing | ||||
St Helen's ward
| Party | Candidate | Votes | % | ±% | |
|---|---|---|---|---|---|
| Labour | Dave Leech | 1,238 | 76.7 | ||
| Conservative | Steven Burkinshaw | 190 | 11.8 | ||
| Green | Alan Jones | 187 | 11.5 | ||
| Majority | 1,048 | 64.9 | |||
| Labour hold | Swing | ||||
Stairfoot ward
| Party | Candidate | Votes | % | ±% | |
|---|---|---|---|---|---|
| Labour | Janine Bowler | 1,173 | 59.9 | ||
| Barnsley Ind. | Andy Gillis | 521 | 26.6 | N/A | |
| Conservative | Mark Brook | 265 | 13.5 | ||
| Majority | 652 | 33.3 | |||
| Labour hold | Swing | ||||
Wombwell ward
| Party | Candidate | Votes | % | ±% | |
|---|---|---|---|---|---|
| Labour | Robert Frost | 1,363 | 67.5 | ||
| Conservative | Joe Colville | 415 | 20.5 | ||
| Green | Terence Cook | 240 | 12.0 | N/A | |
| Majority | 948 | 47.0 | |||
| Labour hold | Swing | ||||
Worsbrough ward
| Party | Candidate | Votes | % | ±% | |
|---|---|---|---|---|---|
| Labour | John Clarke | 1,209 | 62.8 | ||
| Conservative | Michael Barraclough | 331 | 20.6 | ||
| Liberal Democrats | Sarah Calvert | 266 | 16.6 | N/A | |
| Majority | 878 | 42.2 | |||
| Labour hold | Swing | ||||
By-elections between 2018 and 2019
| Party | Candidate | Votes | % | ±% | |
|---|---|---|---|---|---|
| Labour | Jo Newing | 548 | 44.2 | -10.6 | |
| Democrats and Veterans | Gavin Felton | 338 | 27.3 | +27.3 | |
| Conservative | Clive Watkinson | 157 | 12.7 | -2.5 | |
| Liberal Democrats | Kevin Bennett | 124 | 10.0 | +2.5 | |
| Yorkshire | Tony Devoy | 47 | 3.8 | +3.8 | |
| BNP | Christopher Houston | 25 | 2.0 | +2.0 | |
| Majority | 210 | 16.9 | |||
| Turnout | 1,239 | ||||
| Labour hold | Swing | ||||
References
- ↑ "Local government and combined authority mayoral elections - Thursday 3 May 2018". barnsley.gov.uk. Barnsley Metropolitan Borough Council. Retrieved 24 April 2018.
- ↑ "Barnsley local election results 2018". www.barnsley.gov.uk. Retrieved 5 May 2018.
- ↑ "Local Elections Archive Project — Old Town Ward". www.andrewteale.me.uk. Retrieved 18 April 2022.
| Barnsley | |
|---|---|
| Doncaster | |
| Rotherham | |
| Sheffield |
|
| South Yorkshire CC |
|
| West Riding CC | |
| Metro Mayor | |
| |
This article is issued from Wikipedia. The text is licensed under Creative Commons - Attribution - Sharealike. Additional terms may apply for the media files.