| |||||||||||||||||||||
All 39 seats in the Canterbury City Council 20 seats needed for a majority | |||||||||||||||||||||
|---|---|---|---|---|---|---|---|---|---|---|---|---|---|---|---|---|---|---|---|---|---|
| |||||||||||||||||||||
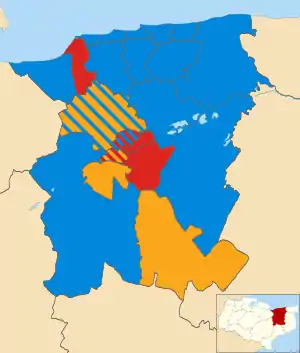 Map of the results of the 2019 Canterbury council election. Conservatives in blue, Labour in red and Liberal Democrats in yellow. | |||||||||||||||||||||
| |||||||||||||||||||||
The 2019 Canterbury City Council election took place on 2 May 2019 to elect members of the Canterbury City Council in Kent, England. This was on the same day as other local elections. The Conservative Party retained overall control of the council.[1]
Summary
Election result
| 2019 Canterbury City Council election[2] | ||||||||||
|---|---|---|---|---|---|---|---|---|---|---|
| Party | Candidates | Seats | Gains | Losses | Net gain/loss | Seats % | Votes % | Votes | +/− | |
| Conservative | 39 | 23 | 2 | 10 | 59.0 | 35.4 | 26,848 | –3.4 | ||
| Labour | 39 | 10 | 7 | 0 | 25.6 | 29.4 | 22,279 | +6.0 | ||
| Liberal Democrats | 34 | 6 | 3 | 0 | 15.4 | 19.7 | 14,972 | +6.0 | ||
| Green | 24 | 0 | 0 | 0 | 0.0 | 12.5 | 9,502 | +1.9 | ||
| Independent | 5 | 0 | 0 | 0 | 0.0 | 2.3 | 1,780 | +2.0 | ||
| UKIP | 2 | 0 | 0 | 2 | 0.0 | 0.5 | 344 | –12.5 | ||
| Foundation | 1 | 0 | 0 | 0 | 0.0 | 0.2 | 161 | N/A | ||
Results by Ward
Barton
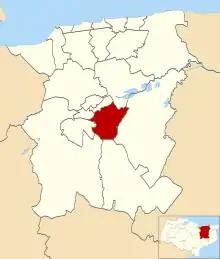
Location of Barton ward
| Party | Candidate | Votes | % | ±% | |
|---|---|---|---|---|---|
| Labour | Pat Edwards | 958 | 35.4 | +11.0 | |
| Labour | Connie Nolan | 954 | 35.3 | +11.4 | |
| Labour | Dave Wilson | 805 | 29.8 | +8.2 | |
| Liberal Democrats | Ida Linfield | 795 | 29.4 | +3.5 | |
| Liberal Democrats | Tom Hopkins | 758 | 28.0 | +6.4 | |
| Liberal Democrats | Martin Roche | 670 | 24.8 | +6.4 | |
| Conservative | Steven Williams | 622 | 23.0 | -3.2 | |
| Conservative | Len Brown | 598 | 22.1 | -4.7 | |
| Green | Stephen Peckham | 586 | 21.7 | +7.4 | |
| Conservative | Conor Dobbs | 583 | 21.6 | -4.5 | |
| Independent | Blue Cooper Bem | 233 | 8.6 | N/A | |
| Turnout | 2,722 | 36 | |||
| Labour gain from Conservative | Swing | ||||
| Labour gain from Conservative | Swing | ||||
| Labour gain from Conservative | Swing | ||||
Beltinge
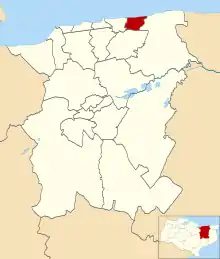
Location of Beltinge ward
| Party | Candidate | Votes | % | ±% | |
|---|---|---|---|---|---|
| Conservative | Ian Stockley | 938 | 50.2 | +4.0 | |
| Conservative | Jeanette Stockley | 921 | 49.3 | +8.8 | |
| Green | Nicholas Gadsby | 426 | 22.8 | N/A | |
| Liberal Democrats | Ann Anderson | 388 | 20.8 | N/A | |
| Labour | Tom Mellish | 314 | 16.8 | -3.8 | |
| Labour | Christine Wheeldon | 299 | 16.0 | -7.0 | |
| Liberal Democrats | Christopher Palmer | 193 | 10.3 | N/A | |
| Turnout | 1,916 | 32 | |||
| Conservative hold | Swing | ||||
| Conservative hold | Swing | ||||
Blean Forest
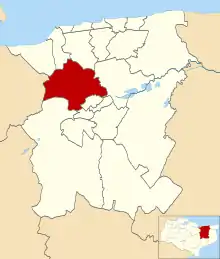
Location of Blean Forest ward
| Party | Candidate | Votes | % | ±% | |
|---|---|---|---|---|---|
| Liberal Democrats | Alex Ricketts | 612 | 31.6 | +8.6 | |
| Conservative | Barbara Flack | 583 | 30.1 | -11.5 | |
| Liberal Democrats | Dan Smith | 567 | 29.3 | +10.7 | |
| Liberal Democrats | George Metcalfe | 564 | 29.2 | -2.4 | |
| Conservative | Benjamin Fitter-Harding | 534 | 27.6 | -7.9 | |
| Labour | Gethin Banks | 454 | 23.5 | -0.1 | |
| Conservative | Sergiu Barna | 434 | 22.4 | -9.2 | |
| Labour | Michael Prowse | 429 | 22.2 | +0.2 | |
| Green | Anna Peckham | 425 | 22.0 | +5.7 | |
| Labour | Ryan Smith | 400 | 20.7 | -0.1 | |
| Independent | Joe Egerton | 328 | 17.0 | N/A | |
| Turnout | 1,954 | 35 | |||
| Liberal Democrats gain from Conservative | Swing | ||||
| Conservative hold | Swing | ||||
| Liberal Democrats gain from Conservative | Swing | ||||
George Metcalfe was elected as a Conservative in 2015. The change in voteshare is shown from his result then, rather than the Liberal Democrat candidate.
Chartham and Stone Street

Location of Chartham and Stone Street ward
| Party | Candidate | Votes | % | ±% | |
|---|---|---|---|---|---|
| Conservative | Robert Thomas | 900 | 37.3 | +2.4 | |
| Conservative | Matthew Jones-Roberts | 857 | 35.5 | -5.3 | |
| Labour | Peter Forrest | 665 | 27.6 | +12.0 | |
| Labour | Lucas Pearce | 648 | 26.9 | +14.0 | |
| Green | Jay Day | 525 | 21.8 | +7.7 | |
| Liberal Democrats | James Galloway | 410 | 17.0 | -0.1 | |
| Liberal Democrats | Paul Smith | 277 | 11.5 | -0.7 | |
| UKIP | Brian MacDowall | 220 | 9.1 | -7.9 | |
| Turnout | 2,426 | 43 | |||
| Conservative hold | Swing | ||||
| Conservative hold | Swing | ||||
Chestfield
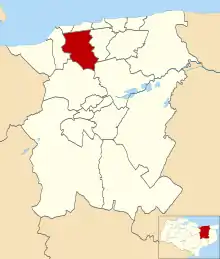
Location of Chestfield ward
| Party | Candidate | Votes | % | ±% | |
|---|---|---|---|---|---|
| Conservative | Jenny Samper | 1,084 | 54.9 | -0.2 | |
| Conservative | Pat Todd | 1,071 | 54.3 | +6.1 | |
| Liberal Democrats | Jonathan Dearth | 342 | 17.3 | +8.0 | |
| Liberal Democrats | Sarah Wehner | 340 | 17.2 | +10.4 | |
| Labour | Lynette Aitken | 324 | 16.4 | +1.2 | |
| Green | Nicole David | 314 | 15.9 | +6.7 | |
| Labour | Charlie Mower | 257 | 13.0 | -0.7 | |
| Turnout | 2,013 | 35 | |||
| Conservative hold | Swing | ||||
| Conservative hold | Swing | ||||
Gorrell
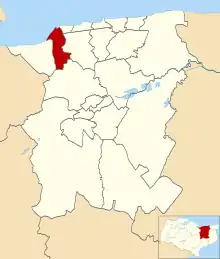
Location of Gorrell ward
| Party | Candidate | Votes | % | ±% | |
|---|---|---|---|---|---|
| Labour | George Caffery | 1,418 | 42.3 | +11.9 | |
| Labour | Chris Cornell | 1,416 | 42.3 | +15.0 | |
| Labour | Valerie Kenny | 1,307 | 39.0 | +12.0 | |
| Green | Alex Stevens | 1,298 | 38.7 | +23.8 | |
| Green | Jolyon Trimingham | 894 | 26.7 | +13.4 | |
| Conservative | Brian Baker | 889 | 26.5 | -6.1 | |
| Conservative | Derek Horne | 707 | 21.1 | -9.4 | |
| Conservative | Crispin Rampling | 690 | 20.6 | -2.9 | |
| Green | Beryl Wilson | 638 | 19.0 | +5.8 | |
| Liberal Democrats | Andrew Palmer | 262 | 7.8 | -1.0 | |
| Turnout | 3,404 | 41 | |||
| Labour gain from Conservative | Swing | ||||
| Labour gain from Conservative | Swing | ||||
| Labour hold | Swing | ||||
Greenhill
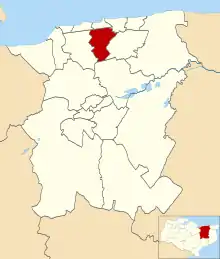
Location of Greenhill ward
| Party | Candidate | Votes | % | ±% | |
|---|---|---|---|---|---|
| Conservative | Dan Watkins | 373 | 46.2 | +11.3 | |
| Labour | Roger Dengate | 201 | 24.9 | -3.1 | |
| Foundation | David Hirst | 161 | 20.0 | -17.0 | |
| Green | Job Dexters | 78 | 9.7 | N/A | |
| Turnout | 819 | 27 | |||
| Conservative gain from UKIP | Swing | ||||
Herne & Broomfield
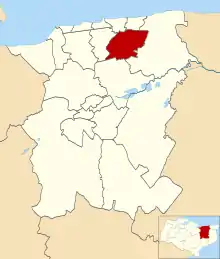
Location of Herne and Broomfield ward
| Party | Candidate | Votes | % | ±% | |
|---|---|---|---|---|---|
| Conservative | Joe Howes | 914 | 54.8 | +8.1 | |
| Conservative | Anne Dekker | 830 | 49.8 | +9.5 | |
| Liberal Democrats | John Bowley | 390 | 23.4 | N/A | |
| Labour | Karen Douglas | 290 | 17.4 | +1.2 | |
| Green | Elliot Settle | 259 | 15.5 | +5.8 | |
| Labour | Malcolm White | 234 | 14.0 | +1.1 | |
| Liberal Democrats | Jeremy Wilson | 209 | 12.5 | N/A | |
| Turnout | 1,723 | 27 | |||
| Conservative hold | Swing | ||||
| Conservative hold | Swing | ||||
Heron
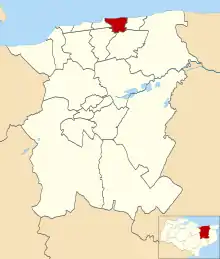
Location of Heron ward
| Party | Candidate | Votes | % | ±% | |
|---|---|---|---|---|---|
| Conservative | Andrew Cook | 1,226 | 44.1 | +2.8 | |
| Conservative | David Thomas | 1,107 | 39.8 | +7.6 | |
| Conservative | Steve Wilson-Hamilton | 1,021 | 36.7 | +3.2 | |
| Labour | Lynn Faux-Bowyer | 703 | 25.3 | +5.3 | |
| Green | Nathan Tough | 658 | 23.7 | +12.5 | |
| Labour | Gilbert House | 618 | 22.2 | +5.5 | |
| Labour | Luke Sullivan | 593 | 21.3 | +6.7 | |
| Independent | Michael Seymour | 554 | 19.9 | N/A | |
| Liberal Democrats | Helen Sole | 353 | 12.7 | +1.2 | |
| Liberal Democrats | Cliff Arter | 331 | 11.9 | +2.6 | |
| Liberal Democrats | Graham Wood | 306 | 11.0 | +4.6 | |
| Turnout | 2,825 | 29 | |||
| Conservative hold | Swing | ||||
| Conservative hold | Swing | ||||
| Conservative hold | Swing | ||||
Little Stour & Adisham

Location of Little Stour & Adisham
| Party | Candidate | Votes | % | ±% | |
|---|---|---|---|---|---|
| Conservative | Louise Jones-Roberts | 549 | 41.5 | -7.4 | |
| Liberal Democrats | Graham Duplock | 351 | 26.5 | +2.1 | |
| Labour | Kevin Power | 228 | 17.2 | +2.6 | |
| Green | Keith Bothwell | 197 | 14.9 | +2.9 | |
| Turnout | 1,359 | 44 | |||
| Conservative hold | Swing | ||||
Nailbourne
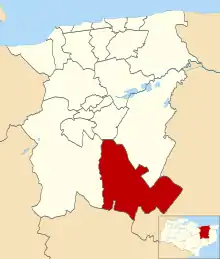
Location of Nailbourne ward
| Party | Candidate | Votes | % | ±% | |
|---|---|---|---|---|---|
| Liberal Democrats | Michael Sole | 831 | 49.9 | ||
| Conservative | Simon Cook | 593 | 35.7 | ||
| UKIP | Mike Ferguson | 124 | 7.5 | ||
| Labour | Evelyn Andrews | 115 | 6.9 | ||
| Turnout | 1,669 | 53 | |||
| Liberal Democrats gain from Conservative | Swing | ||||
Northgate

Location of Northgate ward
| Party | Candidate | Votes | % | ±% | |
|---|---|---|---|---|---|
| Labour | Alan Baldock | 568 | 54.3 | +12.7 | |
| Labour | Jean Butcher | 520 | 49.7 | +11.5 | |
| Conservative | Tom Barton | 238 | 22.7 | -9.3 | |
| Conservative | Jake Warman | 220 | 21.0 | -4.2 | |
| Green | Gillian Everatt | 167 | 16.0 | -7.5 | |
| Liberal Democrats | Valerie Ainscough | 133 | 12.7 | +0.1 | |
| Liberal Democrats | Brian McHenry | 99 | 9.5 | ±0.0 | |
| Green | Jo Kidd | 87 | 8.3 | N/A | |
| Turnout | 1,058 | 28 | |||
| Labour hold | Swing | ||||
| Labour hold | Swing | ||||
Reculver
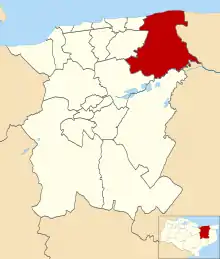
Location of Reculver ward
| Party | Candidate | Votes | % | ±% | |
|---|---|---|---|---|---|
| Conservative | Rachel Carnac | 568 | 57.3 | -13.7 | |
| Labour | Barbara Ayling | 227 | 22.9 | -6.1 | |
| Liberal Democrats | Monica Eden-Green | 109 | 11.0 | N/A | |
| Green | Terry Thompson | 88 | 8.9 | N/A | |
| Turnout | 1,015 | 33 | |||
| Conservative hold | Swing | ||||
Seasalter
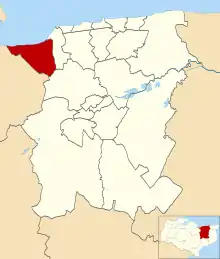
Location of Sealsalter ward
| Party | Candidate | Votes | % | ±% | |
|---|---|---|---|---|---|
| Conservative | Ashley Clark | 1,260 | 54.2 | +13.1 | |
| Conservative | Colin Spooner | 1,206 | 51.9 | +17.3 | |
| Labour | Clare Connerton | 557 | 24.0 | +5.3 | |
| Labour | Helen Kirk | 550 | 23.7 | +7.7 | |
| Green | Kathy Nalson | 455 | 19.6 | +9.6 | |
| Liberal Democrats | John Brazier | 223 | 9.6 | +1.7 | |
| Liberal Democrats | Yvonne Hawkins | 205 | 8.8 | +1.6 | |
| Turnout | 2,370 | 38 | |||
| Conservative hold | Swing | ||||
| Conservative hold | Swing | ||||
St Stephen's
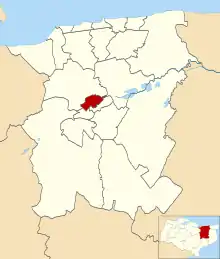
Location of St Stephen's ward
| Party | Candidate | Votes | % | ±% | |
|---|---|---|---|---|---|
| Conservative | Terry Westgate | 733 | 35.0 | +5.8 | |
| Labour | Mel Dawkins | 710 | 33.9 | +7.5 | |
| Labour | Ben Hickman | 659 | 31.5 | +7.3 | |
| Conservative | Sally Waters | 644 | 30.7 | +3.1 | |
| Liberal Democrats | Nick Barnes | 444 | 21.2 | +3.7 | |
| Liberal Democrats | Neasa MacErleen | 442 | 21.1 | +8.1 | |
| Green | Tom Sharp | 398 | 19.0 | +1.1 | |
| Turnout | 2,119 | 40 | |||
| Conservative hold | Swing | ||||
| Labour gain from Conservative | Swing | ||||
Sturry
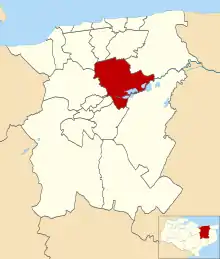
Location of Sturry ward
| Party | Candidate | Votes | % | ±% | |
|---|---|---|---|---|---|
| Conservative | Georgina Glover | 724 | 37.6 | -5.8 | |
| Conservative | Louise Harvey-Quirke | 678 | 35.2 | -2.9 | |
| Labour | Amy License | 487 | 25.3 | +1.3 | |
| Green | Martin Baker | 426 | 22.1 | +8.1 | |
| Independent | Heather Taylor | 426 | 22.1 | -16.0 | |
| Labour | Jane McNicholl | 398 | 20.7 | +2.4 | |
| Green | Tim Palmer | 397 | 20.6 | +8.5 | |
| Turnout | 1,952 | 33 | |||
| Conservative hold | Swing | ||||
| Conservative hold | Swing | ||||
Swalecliffe
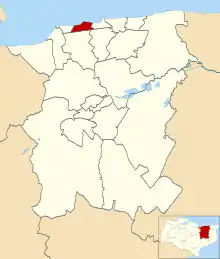
Location of Swalecliffe ward
| Party | Candidate | Votes | % | ±% | |
|---|---|---|---|---|---|
| Conservative | Ian Thomas | 537 | 46.3 | +9.4 | |
| Labour | Morag Warren | 357 | 30.8 | +6.4 | |
| Green | Julie Ellis | 185 | 15.9 | +10.6 | |
| Liberal Democrats | Archie Ratcliffe | 81 | 7.0 | -0.5 | |
| Turnout | 1,198 | 37 | |||
| Conservative hold | Swing | ||||
Tankerton
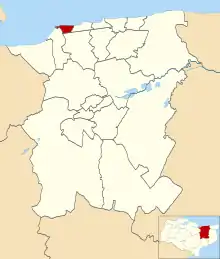
Location of Tankerton ward
| Party | Candidate | Votes | % | ±% | |
|---|---|---|---|---|---|
| Conservative | Neil Baker | 437 | 34.4 | -13.4 | |
| Liberal Democrats | James Flanagan | 433 | 34.0 | +19.4 | |
| Labour | Tricia Cooney | 402 | 31.6 | +8.0 | |
| Turnout | 1,295 | 46 | |||
| Conservative hold | Swing | ||||
West Bay
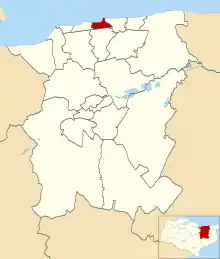
Location of West Bay ward
| Party | Candidate | Votes | % | ±% | |
|---|---|---|---|---|---|
| Conservative | Peter Vickery-Jones | 443 | 48.5 | +8.8 | |
| Labour | Nigel Durrant | 216 | 23.6 | +3.0 | |
| Green | Roger Everatt | 147 | 16.1 | N/A | |
| Liberal Democrats | Mary Hughes | 108 | 11.8 | N/A | |
| Turnout | 948 | 29 | |||
| Conservative gain from UKIP | Swing | ||||
Westgate
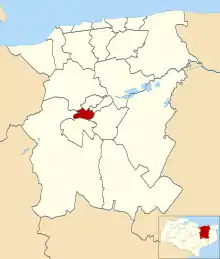
Location of Westgate ward
| Party | Candidate | Votes | % | ±% | |
|---|---|---|---|---|---|
| Liberal Democrats | Michael Dixey | 884 | 40.3 | +15.8 | |
| Labour | Gill Gower | 802 | 36.5 | +16.3 | |
| Labour | Simon Warley | 763 | 34.7 | +15.6 | |
| Liberal Democrats | Alex Lister | 699 | 31.8 | +9.5 | |
| Independent | Allen Tullet | 239 | 10.9 | N/A | |
| Conservative | Oliver Feaver | 227 | 10.3 | -17.6 | |
| Green | Benjamin Grillet | 220 | 10.0 | -10.3 | |
| Conservative | Daniel Sydenham | 214 | 9.7 | -12.9 | |
| Green | Tom Williams | 194 | 8.8 | -7.7 | |
| Turnout | 2,206 | 41 | |||
| Liberal Democrats hold | Swing | ||||
| Labour gain from Conservative | Swing | ||||
Wincheap
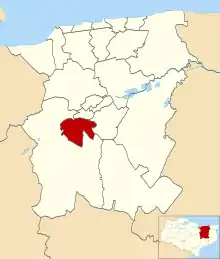
Location of Wincheap ward
| Party | Candidate | Votes | % | ±% | |
|---|---|---|---|---|---|
| Liberal Democrats | Nick Eden-Green | 1,201 | 47.9 | +18.2 | |
| Liberal Democrats | Derek Maslin | 962 | 38.4 | +12.5 | |
| Labour | Zoila Santos | 756 | 30.2 | +5.3 | |
| Labour | Paul Todd | 677 | 27.0 | +7.7 | |
| Green | Pat Marsh | 440 | 17.6 | +2.5 | |
| Conservative | Susan Kilczewski | 353 | 14.1 | -5.5 | |
| Conservative | Christian Mills | 342 | 13.7 | -4.1 | |
| Turnout | 2,524 | 42 | |||
| Liberal Democrats hold | Swing | ||||
| Liberal Democrats hold | Swing | ||||
By-elections
Swalecliffe
| Party | Candidate | Votes | % | ±% | |
|---|---|---|---|---|---|
| Conservative | Mark Dance | 616 | 42.6 | -3.7 | |
| Green | Keith Bothwell | 527 | 36.5 | +20.6 | |
| Labour | Craig Potter | 278 | 19.2 | -11.6 | |
| Independent | Joseph Egerton | 24 | 1.7 | N/A | |
| Majority | 89 | 6.1 | |||
| Turnout | 1,445 | ||||
| Conservative hold | Swing | ||||
Westgate
| Party | Candidate | Votes | % | ±% | |
|---|---|---|---|---|---|
| Labour | Pip Hazelton | 842 | 39.2 | +5.4 | |
| Liberal Democrats | Alex Lister | 661 | 30.8 | -6.5 | |
| Conservative | Jake Warman | 404 | 18.8 | +9.2 | |
| Green | Terry Thompson | 242 | 11.3 | +2.0 | |
| Majority | 181 | 8.4 | |||
| Turnout | 2,149 | ||||
| Labour hold | Swing | ||||
Gorrell
| Party | Candidate | Votes | % | ±% | |
|---|---|---|---|---|---|
| Green | Clare Turnbull | 1,149 | 43.9 | +10.3 | |
| Labour | Dane Buckman | 803 | 30.7 | -6.0 | |
| Conservative | Stephen Spencer | 608 | 23.2 | +0.2 | |
| Workers Party | Colin Gardner | 58 | 2.2 | New | |
| Majority | 346 | 13.2 | N/A | ||
| Turnout | 2,627 | 31.5 | |||
| Green gain from Labour | Swing | ||||
References
This article is issued from Wikipedia. The text is licensed under Creative Commons - Attribution - Sharealike. Additional terms may apply for the media files.