34°46′39.78″N 86°46′51.62″W / 34.7777167°N 86.7810056°W
| Alabama's 5th congressional district | |||
|---|---|---|---|
Interactive map of district boundaries | |||
| Representative |
| ||
| Area | 4,689 sq mi (12,140 km2) | ||
| Distribution |
| ||
| Population (2022) | 743,238[2] | ||
| Median household income | $73,698[3] | ||
| Ethnicity |
| ||
| Occupation |
| ||
| Cook PVI | R+17[4] | ||
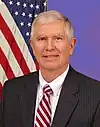
Alabama's 5th congressional district is a U.S. congressional district in Alabama, which elects a representative to the United States House of Representatives. It encompasses the counties of Lauderdale, Limestone, Madison, Morgan and most of Jackson. It is currently represented by Republican Dale Strong, a former Madison County Commissioner. Strong was first elected in 2022 following the retirement of Republican incumbent Mo Brooks.
Character
Two major economic projects have lastingly impacted the 5th district and have indelibly dictated the politics of North Alabama for most of the 20th Century. Before 1933, the Northern Alabama counties were characteristically poor, white and rural. The Tennessee Valley Authority's (TVA) arrival changed much of that, slowly transforming the demographic towards technical and engineering employees. The second major project was the space and rocketry programs including Redstone Arsenal in Huntsville where the first large U.S. Ballistic missiles were developed. Additionally, NASA built the Marshall Space Flight Center in the Huntsville-Decatur area during the 1960s. In the late 1950s Northern Alabama came to be dominated by the high-tech and engineering industries, a trend which has continued up to the present. In recent years, the United Launch Alliance has located its research center in Decatur. As a result, Huntsville has become the second largest and fastest growing metropolitan area in Alabama.
For a time, the district bucked the increasing Republican trend in Alabama. It was the only district in the state that supported Walter Mondale in 1984, but hasn't supported a Democrat for president since then. Democrats continue to hold most offices at the local level, and continued to hold most of the district's seats in the Alabama state legislature until the Republicans swept nearly all of north Alabama's seats in 2010. In the mid-1990s, it was a seriously contested seat, with longtime Democratic incumbent Bud Cramer winning reelection by only 1,770 votes in 1994. However, Cramer was elected five more times with 70 percent or more of the vote and even ran unopposed in the Democratic landslide year of 2006. Cramer did not seek reelection in 2008. Parker Griffith, a retired oncologist and State Senator, won the open seat in November 2008. However, in December 2009, Griffith became a Republican. Until Griffith's switch, the district had been one of the last in the former Confederacy not to have sent a Republican to the U.S. Congress since Reconstruction. Griffith was ousted in the Republican primary by former Representative Mo Brooks.
George W. Bush won 60% of the vote in this district in 2004. John McCain also carried the 5th district in 2008 with 60.91% of the vote while Barack Obama received 37.99%.
Recent election results from statewide races
| Year | Office | Results |
|---|---|---|
| 2000 | President | Bush 54–44% |
| 2004 | President | Bush 60–39% |
| 2008 | President | McCain 61–38% |
| 2012 | President | Romney 64–35% |
| 2016 | President | Trump 65–31% |
| 2017 | Senate | Moore 49–49% |
| 2020 | President | Trump 63–36% |
| 2022 | Senate | Britt 67–30% |
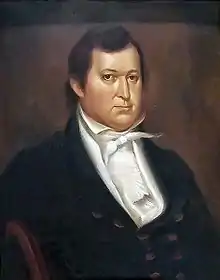
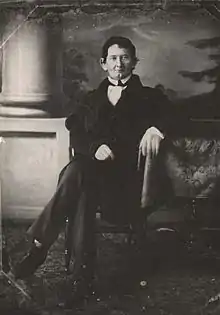
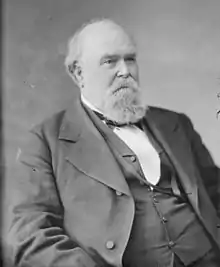
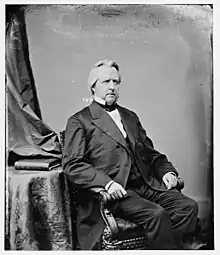
List of members representing the district
Recent election results
These are the results from the previous ten election cycles in Alabama's 5th district.[5]
2002
| Party | Candidate | Votes | % | |
|---|---|---|---|---|
| Democratic | Robert E. Cramer (incumbent) | 142,029 | 73.15% | |
| Republican | Stephen P. Engel | 48,226 | 24.84% | |
| Libertarian | Alan F. Barksdale | 3,772 | 1.94% | |
| Write-in | 144 | 0.07% | ||
| Total votes | 194,171 | 100% | ||
| Democratic hold | ||||
2004
| Party | Candidate | Votes | % | |
|---|---|---|---|---|
| Democratic | Robert E. Cramer (incumbent) | 200,999 | 72.97% | |
| Republican | Gerald "Gerry" Wallace | 74,145 | 26.92% | |
| Write-in | 315 | 0.11% | ||
| Total votes | 275,459 | 100% | ||
| Democratic hold | ||||
2006
| Party | Candidate | Votes | % | |
|---|---|---|---|---|
| Democratic | Robert E. Cramer (incumbent) | 143,015 | 98.26% | |
| Write-in | 2,540 | 1.75% | ||
| Total votes | 145,555 | 100% | ||
| Democratic hold | ||||
2008
| Party | Candidate | Votes | % | |
|---|---|---|---|---|
| Democratic | Parker Griffith | 158,324 | 51.52% | |
| Republican | Wayne Parker | 147,314 | 47.94% | |
| Write-in | 1,644 | 0.54% | ||
| Total votes | 307,282 | 100% | ||
| Democratic hold | ||||
2010
| Party | Candidate | Votes | % | |
|---|---|---|---|---|
| Republican | Mo Brooks | 131,109 | 57.89% | |
| Democratic | Steve Raby | 95,192 | 42.03% | |
| Write-in | 189 | 0.08% | ||
| Total votes | 226,490 | 100% | ||
| Republican hold | ||||
2012
| Party | Candidate | Votes | % | |
|---|---|---|---|---|
| Republican | Mo Brooks (incumbent) | 189,185 | 64.95% | |
| Democratic | Charlie L. Holley | 101,772 | 34.94% | |
| Write-in | 336 | 0.12% | ||
| Total votes | 291,293 | 100% | ||
| Republican hold | ||||
2014
| Party | Candidate | Votes | % | |
|---|---|---|---|---|
| Republican | Mo Brooks (incumbent) | 115,338 | 74.42% | |
| Independent | Mark Bray | 39,005 | 25.17% | |
| Write-in | 631 | 0.41% | ||
| Total votes | 154,974 | 100% | ||
| Republican hold | ||||
2016
| Party | Candidate | Votes | % | |
|---|---|---|---|---|
| Republican | Mo Brooks (incumbent) | 205,647 | 66.70% | |
| Democratic | Willie "Will" Boyd, Jr. | 102,234 | 33.16% | |
| Write-in | 445 | 0.14% | ||
| Total votes | 308,326 | 100% | ||
| Republican hold | ||||
2018
| Party | Candidate | Votes | % | |
|---|---|---|---|---|
| Republican | Mo Brooks (incumbent) | 159,063 | 61.02% | |
| Democratic | Peter Joffrion | 101,388 | 38.90% | |
| Write-in | 222 | 0.09% | ||
| Total votes | 260,673 | 100% | ||
| Republican hold | ||||
2020
| Party | Candidate | Votes | % | |
|---|---|---|---|---|
| Republican | Mo Brooks (incumbent) | 253,094 | 95.81% | |
| Write-in | 11,066 | 4.19% | ||
| Total votes | 264,160 | 100% | ||
| Republican hold | ||||
2022
| Party | Candidate | Votes | % | |
|---|---|---|---|---|
| Republican | Dale Strong | 142,435 | 67.1% | |
| Democratic | Kathy Warner-Stanton | 62,740 | 29.5% | |
| Libertarian | P. J. Greer | 6,773 | 3.2% | |
| Write-in | 369 | 0.2% | ||
| Total votes | 212,317 | 100% | ||
| Republican hold | ||||
See also
References
- Specific
- ↑ "Congressional Districts | 113th 114th Congress Demographics | Urban Rural Patterns".
- ↑ "My Congressional District".
- ↑ "My Congressional District".
- ↑ "2022 Cook PVI: District Map and List". Cook Political Report. Retrieved January 10, 2023.
- ↑ "AL - District 05". Our Campaigns. Retrieved September 22, 2021.
- General
- Martis, Kenneth C. (1989). The Historical Atlas of Political Parties in the United States Congress. New York: Macmillan Publishing Company.
- Martis, Kenneth C. (1982). The Historical Atlas of United States Congressional Districts. New York: Macmillan Publishing Company.
- Congressional Biographical Directory of the United States 1774–present
- "AL - District 05 - History". www.ourcampaigns.com. Retrieved September 22, 2020.
.svg.png.webp)
.svg.png.webp)

.jpg.webp)








.tif.png.webp)

_(new_version).svg.png.webp)