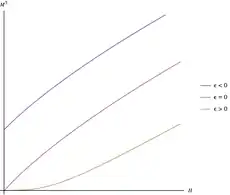
In condensed matter physics, an Arrott plot is a plot of the square of the magnetization of a substance, against the ratio of the applied magnetic field to magnetization at one (or several) fixed temperature(s). Arrott plots are an easy way of determining the presence of ferromagnetic order in a material.[2][3] They are named after American physicist Anthony Arrott who introduced them as a technique for studying magnetism in 1957.[1]
Details
According to the Landau theory applied to the mean field picture for magnetism, the free energy of a ferromagnetic material close to a phase transition can be written as:
where , the magnetization, is the order parameter, is the applied magnetic field, is the critical temperature, and are material constants.
Close to the phase transition, this gives a relation for the magnetization order parameter:
where is a dimensionless measure of the temperature.
Thus in a graph plotting vs. for various temperatures, the line without an intercept corresponds to the dependence at the critical temperature. Thus along with providing evidence for the existence of a ferromagnetic phase, the Arrott plot can also be used to determine the critical temperature for the phase transition.[4][5]
Generalization
Giving the critical exponents explicitly in the equation of state, Arrott and Noakes proposed:[6]
Where are free parameters. In these modified Arrott plots, data is plotted as versus . In the case of classical Landau theory, and and this equation reduces to the linear versus plot. However, the equation also allows for other values of and , since real ferromagnets often do not have critical exponents exactly consistent with a simple mean field theory ferromagnetism.
The use of the correct critical exponents for a given system can help give straight lines on the Arott plot, but not in cases such as low magnetic field and amorphous materials.[7] While mean field theory is a more reasonable model for ferromagnets at higher magnetic fields, the presence of more than one magnetic domain in real magnets means that especially at low magnetic fields, the experimentally measured macroscopic magnetic field (which is an average over the whole sample) will not be a reasonable way to determine the local magnetic field (which is felt by a single atom). Therefore, magnetization data taken at low magnetic fields should be ignored for the purposes of Arrott plots.
Transition order
Magnetic phase transitions can be either first order or second order. The nature of the transition can be inferred from the Arrott plot based on the slope of the magnetic isotherms. If the lines are all positive slope, the phase transition is second order, whereas if there are negative slope lines, the phase transition is first order. This condition is known as the Banerjee criterion.[8][9]
The Banerjee criterion is not always accurate for evaluating inhomogeneous ferromagnets, since the slopes can all be positive even when the transition is first-order.[10]
See also
References
- 1 2 Arrott, A. (1957). "Criterion for Ferromagnetism from Observations of Magnetic Isotherms". Physical Review. 108 (6): 1394–1396. Bibcode:1957PhRv..108.1394A. doi:10.1103/PhysRev.108.1394.
- ↑ Yeung, I.; Roshko, R.; Williams, G. (1986). "Arrott-plot criterion for ferromagnetism in disordered systems". Physical Review B. 34 (5): 3456–3457. Bibcode:1986PhRvB..34.3456Y. doi:10.1103/PhysRevB.34.3456.
- ↑ du Trémolet de Lacheisserie, E., ed. (2005). Magnetism. Springer. ISBN 978-0-387-22967-6.
- ↑ Hadimani, R. L.; Melikhov, Y.; Snyder, J. E.; Jiles, D. C. (2008). "Determination of Curie temperature by Arrott plot technique in Gd5(SixGe1−x)4 for x>0.575". Journal of Magnetism and Magnetic Materials. 320 (20): e696–e698. Bibcode:2008JMMM..320E.696H. doi:10.1016/j.jmmm.2008.04.035.
- ↑ Farle, R. L.; Lewis, Y.; Baberschke, K. (1993). "Detailed analysis of the in sifu magneto-optic Kerr signal of gadoilinium films near the Curie temperature". Applied Physics Letters. 62 (21): 2728–2730. Bibcode:1993ApPhL..62.2728F. doi:10.1063/1.109246.
- ↑ Arrott, Anthony; Noakes, John E. (1967-10-02). "Approximate Equation of State For Nickel Near its Critical Temperature". Physical Review Letters. American Physical Society (APS). 19 (14): 786–789. doi:10.1103/physrevlett.19.786. ISSN 0031-9007.
- ↑ Aharoni, Amikam (1984-12-15). "Amorphicity, heterogeneity, and the Arrott plots". Journal of Applied Physics. AIP Publishing. 56 (12): 3479–3484. doi:10.1063/1.333899. ISSN 0021-8979.
- ↑ Banerjee, B.K. (1964). "On a generalised approach to first and second order magnetic transitions". Physics Letters. Elsevier BV. 12 (1): 16–17. doi:10.1016/0031-9163(64)91158-8. ISSN 0031-9163.
- ↑ Gupta, Sachin; Suresh, K G; Nigam, A K; Knyazev, Yu V; Kuz'min, Yu I; Lukoyanov, A V (2014-08-21). "The magnetic, electronic and optical properties of HoRhGe". Journal of Physics D: Applied Physics. IOP Publishing. 47 (36): 365002. arXiv:1301.6034. doi:10.1088/0022-3727/47/36/365002. ISSN 0022-3727.
- ↑ Bebenin, N.G.; Zainullina, R.I.; Ustinov, V.V.; Mukovskii, Y.M. (2014). "Magnetic properties of La0.7−xPrxCa0.3MnO3 single crystals: When is Banerjee criterion applicable?". Journal of Magnetism and Magnetic Materials. Elsevier BV. 354: 76–80. doi:10.1016/j.jmmm.2013.10.033. ISSN 0304-8853.