| Ballerup | |
|---|---|
| Ballerup | |
| Nomination district constituency for the Folketing | |
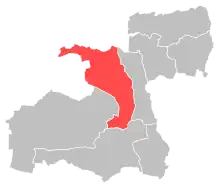 Location of Ballerup within Greater Copenhagen | |
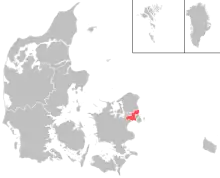 Location of Greater Copenhagen within Denmark | |
| Municipalities | Ballerup Glostrup |
| Constituency | Greater Copenhagen |
| Electorate | 46,519 (2022)[1] |
| Current constituency | |
| Created | 1970[2] |
Ballerup nominating district is one of the 92 nominating districts that was created for Danish elections following the 2007 municipal reform.[3][4][5] It consists of Ballerup and Glostrup municipality.[6] It was created in 1970,[7] though its boundaries have been changed since then.
In general elections, the district is a strong area for parties commonly associated with the red bloc.[8]
General elections results
General elections in the 2020s
| Parties | Vote | |||||
|---|---|---|---|---|---|---|
| Votes | % | + / - | ||||
| Social Democrats | 14,164 | 34.62 | +2.36 | |||
| Moderates | 4,062 | 9.93 | New | |||
| Venstre | 3,885 | 9.49 | -7.15 | |||
| Green Left | 3,763 | 9.20 | +0.03 | |||
| Liberal Alliance | 2,745 | 6.71 | +4.45 | |||
| Conservatives | 1,889 | 4.62 | -1.15 | |||
| Denmark Democrats | 1,882 | 4.60 | New | |||
| Red–Green Alliance | 1,858 | 4.54 | -2.04 | |||
| Danish People's Party | 1,813 | 4.43 | -6.16 | |||
| Social Liberals | 1,484 | 3.63 | -3.92 | |||
| New Right | 1,367 | 3.34 | +0.85 | |||
| The Alternative | 1,093 | 2.67 | +0.28 | |||
| Independent Greens | 697 | 1.70 | New | |||
| Christian Democrats | 160 | 0.39 | -0.68 | |||
| Jovan Tasevski | 46 | 0.11 | New | |||
| Henrik Vendelbo Petersen | 9 | 0.02 | New | |||
| Total | 40,917 | |||||
| Source[9] | ||||||
General elections in the 2010s
| Parties | Vote | |||||
|---|---|---|---|---|---|---|
| Votes | % | + / - | ||||
| Social Democrats | 13,529 | 32.26 | -2.01 | |||
| Venstre | 6,977 | 16.64 | +2.75 | |||
| Danish People's Party | 4,441 | 10.59 | -13.49 | |||
| Green Left | 3,844 | 9.17 | +4.97 | |||
| Social Liberals | 3,165 | 7.55 | +4.09 | |||
| Red–Green Alliance | 2,759 | 6.58 | -1.02 | |||
| Conservatives | 2,422 | 5.77 | +3.42 | |||
| New Right | 1,044 | 2.49 | New | |||
| The Alternative | 1,003 | 2.39 | -1.13 | |||
| Liberal Alliance | 946 | 2.26 | -3.73 | |||
| Stram Kurs | 913 | 2.18 | New | |||
| Christian Democrats | 450 | 1.07 | +0.55 | |||
| Klaus Riskær Pedersen Party | 327 | 0.78 | New | |||
| Mads Palsvig | 108 | 0.26 | New | |||
| Christian B. Olesen | 13 | 0.03 | New | |||
| Total | 41,941 | |||||
| Source[10] | ||||||
| Parties | Vote | |||||
|---|---|---|---|---|---|---|
| Votes | % | + / - | ||||
| Social Democrats | 14,696 | 34.27 | +2.49 | |||
| Danish People's Party | 10,326 | 24.08 | +9.01 | |||
| Venstre | 5,955 | 13.89 | -6.57 | |||
| Red–Green Alliance | 3,260 | 7.60 | +0.84 | |||
| Liberal Alliance | 2,570 | 5.99 | +1.75 | |||
| Green Left | 1,801 | 4.20 | -4.16 | |||
| The Alternative | 1,509 | 3.52 | New | |||
| Social Liberals | 1,484 | 3.46 | -4.77 | |||
| Conservatives | 1,008 | 2.35 | -2.27 | |||
| Christian Democrats | 223 | 0.52 | +0.16 | |||
| Asif Ahmad | 37 | 0.09 | New | |||
| Christian Olesen | 12 | 0.03 | New | |||
| Total | 42,881 | |||||
| Source[11] | ||||||
| Parties | Vote | |||||
|---|---|---|---|---|---|---|
| Votes | % | + / - | ||||
| Social Democrats | 13,919 | 31.78 | -2.90 | |||
| Venstre | 8,959 | 20.46 | +2.56 | |||
| Danish People's Party | 6,599 | 15.07 | -1.77 | |||
| Green Left | 3,661 | 8.36 | -3.96 | |||
| Social Liberals | 3,606 | 8.23 | +4.38 | |||
| Red–Green Alliance | 2,962 | 6.76 | +4.87 | |||
| Conservatives | 2,024 | 4.62 | -4.98 | |||
| Liberal Alliance | 1,858 | 4.24 | +1.75 | |||
| Christian Democrats | 156 | 0.36 | -0.04 | |||
| Christian H. Hansen | 51 | 0.12 | New | |||
| Total | 43,795 | |||||
| Source[12] | ||||||
General elections in the 2000s
| Parties | Vote | |||||
|---|---|---|---|---|---|---|
| Votes | % | + / - | ||||
| Social Democrats | 14,933 | 34.68 | +6.23 | |||
| Venstre | 7,709 | 17.90 | -5.83 | |||
| Danish People's Party | 7,252 | 16.84 | +2.45 | |||
| Green Left | 5,304 | 12.32 | +6.01 | |||
| Conservatives | 4,135 | 9.60 | -3.02 | |||
| Social Liberals | 1,659 | 3.85 | -5.13 | |||
| New Alliance | 1,074 | 2.49 | New | |||
| Red–Green Alliance | 813 | 1.89 | -1.29 | |||
| Christian Democrats | 173 | 0.40 | -0.64 | |||
| Janus Kramer Møller | 4 | 0.01 | New | |||
| Feride Istogu Gillesberg | 1 | 0.00 | New | |||
| Total | 43,057 | |||||
| Source[13] | ||||||
| Parties | Vote | |||||
|---|---|---|---|---|---|---|
| Votes | % | + / - | ||||
| Social Democrats | 13,645 | 28.45 | -2.15 | |||
| Venstre | 11,381 | 23.73 | -4.50 | |||
| Danish People's Party | 6,905 | 14.39 | +0.80 | |||
| Conservatives | 6,052 | 12.62 | +4.17 | |||
| Social Liberals | 4,307 | 8.98 | +3.64 | |||
| Green Left | 3,028 | 6.31 | -0.79 | |||
| Red–Green Alliance | 1,525 | 3.18 | +0.75 | |||
| Centre Democrats | 530 | 1.10 | -1.32 | |||
| Christian Democrats | 501 | 1.04 | -0.56 | |||
| Minority Party | 83 | 0.17 | New | |||
| Nahid Yazdanyar | 12 | 0.03 | New | |||
| Total | 47,969 | |||||
| Source[14] | ||||||
| Parties | Vote | |||||
|---|---|---|---|---|---|---|
| Votes | % | + / - | ||||
| Social Democrats | 15,033 | 30.60 | -5.48 | |||
| Venstre | 13,867 | 28.23 | +8.89 | |||
| Danish People's Party | 6,674 | 13.59 | +3.93 | |||
| Conservatives | 4,149 | 8.45 | -1.22 | |||
| Green Left | 3,486 | 7.10 | -2.40 | |||
| Social Liberals | 2,625 | 5.34 | +1.36 | |||
| Red–Green Alliance | 1,196 | 2.43 | -0.16 | |||
| Centre Democrats | 1,189 | 2.42 | -3.58 | |||
| Christian People's Party | 786 | 1.60 | +0.25 | |||
| Progress Party | 118 | 0.24 | -1.07 | |||
| Total | 49,123 | |||||
| Source[15] | ||||||
General elections in the 1990s
| Parties | Vote | |||||
|---|---|---|---|---|---|---|
| Votes | % | + / - | ||||
| Social Democrats | 17,327 | 36.08 | +1.65 | |||
| Venstre | 9,290 | 19.34 | +2.64 | |||
| Conservatives | 4,643 | 9.67 | -8.89 | |||
| Danish People's Party | 4,641 | 9.66 | New | |||
| Green Left | 4,562 | 9.50 | -0.08 | |||
| Centre Democrats | 2,879 | 6.00 | +1.47 | |||
| Social Liberals | 1,911 | 3.98 | -1.22 | |||
| Red–Green Alliance | 1,244 | 2.59 | -0.85 | |||
| Christian People's Party | 648 | 1.35 | +0.41 | |||
| Progress Party | 628 | 1.31 | -4.01 | |||
| Democratic Renewal | 131 | 0.27 | New | |||
| Mogens Glistrup | 114 | 0.24 | -0.22 | |||
| Poul Bregninge | 3 | 0.01 | New | |||
| Anders Kofoed | 2 | 0.00 | New | |||
| Total | 48,023 | |||||
| Source[16] | ||||||
| Parties | Vote | |||||
|---|---|---|---|---|---|---|
| Votes | % | + / - | ||||
| Social Democrats | 16,262 | 34.43 | -3.85 | |||
| Conservatives | 8,768 | 18.56 | -0.15 | |||
| Venstre | 7,890 | 16.70 | +6.49 | |||
| Green Left | 4,527 | 9.58 | -0.53 | |||
| Progress Party | 2,513 | 5.32 | +1.43 | |||
| Social Liberals | 2,457 | 5.20 | +0.78 | |||
| Centre Democrats | 2,142 | 4.53 | -3.20 | |||
| Red–Green Alliance | 1,624 | 3.44 | +1.53 | |||
| Christian People's Party | 445 | 0.94 | -0.06 | |||
| Niels I. Meyer | 246 | 0.52 | New | |||
| Mogens Glistrup | 218 | 0.46 | New | |||
| Preben Møller Hansen | 131 | 0.28 | New | |||
| Torben Faber | 8 | 0.02 | New | |||
| John Ziegler | 7 | 0.01 | New | |||
| Total | 47,238 | |||||
| Source[17] | ||||||
| Parties | Vote | |||||
|---|---|---|---|---|---|---|
| Votes | % | + / - | ||||
| Social Democrats | 17,555 | 38.28 | +7.57 | |||
| Conservatives | 8,581 | 18.71 | -2.12 | |||
| Venstre | 4,680 | 10.21 | +4.70 | |||
| Green Left | 4,637 | 10.11 | -6.27 | |||
| Centre Democrats | 3,545 | 7.73 | +0.95 | |||
| Social Liberals | 2,026 | 4.42 | -2.47 | |||
| Progress Party | 1,783 | 3.89 | -2.77 | |||
| Common Course | 1,042 | 2.27 | +0.35 | |||
| Red–Green Alliance | 874 | 1.91 | New | |||
| Christian People's Party | 457 | 1.00 | +0.15 | |||
| The Greens | 401 | 0.87 | -0.89 | |||
| Justice Party of Denmark | 260 | 0.57 | New | |||
| Humanist Party | 15 | 0.03 | New | |||
| Total | 45,856 | |||||
| Source[18] | ||||||
General elections in the 1980s
| Parties | Vote | |||||
|---|---|---|---|---|---|---|
| Votes | % | + / - | ||||
| Social Democrats | 14,473 | 30.71 | +1.22 | |||
| Conservatives | 9,820 | 20.83 | -0.86 | |||
| Green Left | 7,723 | 16.38 | -2.14 | |||
| Social Liberals | 3,246 | 6.89 | -1.09 | |||
| Centre Democrats | 3,194 | 6.78 | -0.06 | |||
| Progress Party | 3,138 | 6.66 | +3.31 | |||
| Venstre | 2,597 | 5.51 | +1.84 | |||
| Common Course | 907 | 1.92 | -0.27 | |||
| The Greens | 830 | 1.76 | 0.00 | |||
| Communist Party of Denmark | 524 | 1.11 | -0.02 | |||
| Christian People's Party | 403 | 0.85 | -0.25 | |||
| Left Socialists | 274 | 0.58 | -0.75 | |||
| Leif Hilt | 6 | 0.01 | New | |||
| Total | 47,135 | |||||
| Source[19] | ||||||
| Parties | Vote | |||||
|---|---|---|---|---|---|---|
| Votes | % | + / - | ||||
| Social Democrats | 14,113 | 29.49 | -3.24 | |||
| Conservatives | 10,380 | 21.69 | -1.98 | |||
| Green Left | 8,865 | 18.52 | +2.69 | |||
| Social Liberals | 3,820 | 7.98 | +1.14 | |||
| Centre Democrats | 3,273 | 6.84 | +1.37 | |||
| Venstre | 1,754 | 3.67 | -1.70 | |||
| Progress Party | 1,604 | 3.35 | +0.50 | |||
| Common Course | 1,049 | 2.19 | New | |||
| The Greens | 842 | 1.76 | New | |||
| Left Socialists | 637 | 1.33 | -1.89 | |||
| Communist Party of Denmark | 540 | 1.13 | +0.17 | |||
| Christian People's Party | 527 | 1.10 | +0.05 | |||
| Justice Party of Denmark | 277 | 0.58 | -1.26 | |||
| Humanist Party | 135 | 0.28 | New | |||
| Socialist Workers Party | 28 | 0.06 | -0.05 | |||
| Marxist–Leninists Party | 10 | 0.02 | -0.02 | |||
| Carsten Grøn-Nielsen | 3 | 0.01 | 0.00 | |||
| Per Hillersborg | 1 | 0.00 | New | |||
| Total | 47,858 | |||||
| Source[20] | ||||||
| Parties | Vote | |||||
|---|---|---|---|---|---|---|
| Votes | % | + / - | ||||
| Social Democrats | 15,673 | 32.73 | -0.09 | |||
| Conservatives | 11,332 | 23.67 | +7.90 | |||
| Green Left | 7,578 | 15.83 | +0.05 | |||
| Social Liberals | 3,276 | 6.84 | +0.20 | |||
| Centre Democrats | 2,619 | 5.47 | -3.97 | |||
| Venstre | 2,571 | 5.37 | +1.17 | |||
| Left Socialists | 1,544 | 3.22 | -0.68 | |||
| Progress Party | 1,367 | 2.85 | -4.17 | |||
| Justice Party of Denmark | 879 | 1.84 | -0.01 | |||
| Christian People's Party | 503 | 1.05 | +0.33 | |||
| Communist Party of Denmark | 458 | 0.96 | -0.61 | |||
| Socialist Workers Party | 55 | 0.11 | +0.02 | |||
| Marxist–Leninists Party | 21 | 0.04 | New | |||
| Carsten Grøn-Nielsen | 5 | 0.01 | New | |||
| Mogens Nebelong | 2 | 0.00 | -0.01 | |||
| Poul Rasmussen | 0 | 0.00 | New | |||
| Total | 47,883 | |||||
| Source[21] | ||||||
| Parties | Vote | |||||
|---|---|---|---|---|---|---|
| Votes | % | + / - | ||||
| Social Democrats | 14,582 | 32.82 | -6.59 | |||
| Green Left | 7,011 | 15.78 | +7.25 | |||
| Conservatives | 7,008 | 15.77 | +1.99 | |||
| Centre Democrats | 4,193 | 9.44 | +5.75 | |||
| Progress Party | 3,121 | 7.02 | -1.28 | |||
| Social Liberals | 2,952 | 6.64 | -0.42 | |||
| Venstre | 1,867 | 4.20 | -1.76 | |||
| Left Socialists | 1,735 | 3.90 | -1.73 | |||
| Justice Party of Denmark | 824 | 1.85 | -1.64 | |||
| Communist Party of Denmark | 699 | 1.57 | -1.05 | |||
| Christian People's Party | 320 | 0.72 | -0.18 | |||
| Communist Workers Party | 81 | 0.18 | -0.45 | |||
| Socialist Workers Party | 40 | 0.09 | New | |||
| Mogens Nebelong | 3 | 0.01 | New | |||
| Total | 44,436 | |||||
| Source[22] | ||||||
General elections in the 1970s
| Parties | Vote | |||||
|---|---|---|---|---|---|---|
| Votes | % | + / - | ||||
| Social Democrats | 17,332 | 39.41 | -0.15 | |||
| Conservatives | 6,058 | 13.78 | +5.40 | |||
| Green Left | 3,752 | 8.53 | +2.13 | |||
| Progress Party | 3,652 | 8.30 | -3.83 | |||
| Social Liberals | 3,105 | 7.06 | +3.65 | |||
| Venstre | 2,621 | 5.96 | +0.96 | |||
| Left Socialists | 2,478 | 5.63 | +1.50 | |||
| Centre Democrats | 1,621 | 3.69 | -5.65 | |||
| Justice Party of Denmark | 1,535 | 3.49 | -0.96 | |||
| Communist Party of Denmark | 1,154 | 2.62 | -2.71 | |||
| Christian People's Party | 394 | 0.90 | -0.47 | |||
| Communist Workers Party | 276 | 0.63 | New | |||
| Total | 43,978 | |||||
| Source[23] | ||||||
| Parties | Vote | |||||
|---|---|---|---|---|---|---|
| Votes | % | + / - | ||||
| Social Democrats | 16,844 | 39.56 | +10.23 | |||
| Progress Party | 5,165 | 12.13 | -1.50 | |||
| Centre Democrats | 3,978 | 9.34 | +5.93 | |||
| Conservatives | 3,567 | 8.38 | +2.34 | |||
| Green Left | 2,727 | 6.40 | -3.05 | |||
| Communist Party of Denmark | 2,270 | 5.33 | -0.95 | |||
| Venstre | 2,130 | 5.00 | -10.89 | |||
| Justice Party of Denmark | 1,894 | 4.45 | +2.04 | |||
| Left Socialists | 1,757 | 4.13 | +1.17 | |||
| Social Liberals | 1,452 | 3.41 | -4.18 | |||
| Christian People's Party | 583 | 1.37 | -1.59 | |||
| Pensioners' Party | 209 | 0.49 | New | |||
| Poul Rasmussen | 1 | 0.00 | New | |||
| Otto Jensen | 0 | 0.00 | New | |||
| Total | 42,577 | |||||
| Source[24] | ||||||
| Parties | Vote | |||||
|---|---|---|---|---|---|---|
| Votes | % | + / - | ||||
| Social Democrats | 11,994 | 29.33 | +6.70 | |||
| Venstre | 6,498 | 15.89 | +9.63 | |||
| Progress Party | 5,574 | 13.63 | -1.40 | |||
| Green Left | 3,864 | 9.45 | -1.13 | |||
| Social Liberals | 3,103 | 7.59 | -1.82 | |||
| Communist Party of Denmark | 2,566 | 6.28 | +1.01 | |||
| Conservatives | 2,469 | 6.04 | -3.75 | |||
| Centre Democrats | 1,396 | 3.41 | -9.93 | |||
| Left Socialists | 1,210 | 2.96 | +0.63 | |||
| Christian People's Party | 1,209 | 2.96 | +1.14 | |||
| Justice Party of Denmark | 986 | 2.41 | -1.13 | |||
| J. G. Amdrejcak | 10 | 0.02 | New | |||
| Kai Clemmensen | 4 | 0.01 | New | |||
| Henning Glahn | 3 | 0.01 | New | |||
| Poul Friborg | 1 | 0.00 | New | |||
| Total | 40,887 | |||||
| Source[25] | ||||||
| Parties | Vote | |||||
|---|---|---|---|---|---|---|
| Votes | % | + / - | ||||
| Social Democrats | 9,406 | 22.63 | -13.88 | |||
| Progress Party | 6,248 | 15.03 | New | |||
| Centre Democrats | 5,545 | 13.34 | New | |||
| Green Left | 4,399 | 10.58 | -4.44 | |||
| Conservatives | 4,068 | 9.79 | -10.85 | |||
| Social Liberals | 3,910 | 9.41 | -4.17 | |||
| Venstre | 2,603 | 6.26 | -0.54 | |||
| Communist Party of Denmark | 2,191 | 5.27 | +2.96 | |||
| Justice Party of Denmark | 1,471 | 3.54 | +1.95 | |||
| Left Socialists | 968 | 2.33 | -0.19 | |||
| Christian People's Party | 755 | 1.82 | +1.09 | |||
| Erik Dissing | 8 | 0.02 | New | |||
| Total | 41,572 | |||||
| Source[26] | ||||||
| Parties | Vote | |||||
|---|---|---|---|---|---|---|
| Votes | % | + / - | ||||
| Social Democrats | 13,872 | 36.51 | ||||
| Conservatives | 7,842 | 20.64 | ||||
| Green Left | 5,707 | 15.02 | ||||
| Social Liberals | 5,161 | 13.58 | ||||
| Venstre | 2,584 | 6.80 | ||||
| Left Socialists | 958 | 2.52 | ||||
| Communist Party of Denmark | 876 | 2.31 | ||||
| Justice Party of Denmark | 604 | 1.59 | ||||
| Christian People's Party | 279 | 0.73 | ||||
| Henning Berthelsen | 115 | 0.30 | ||||
| Total | 37,998 | |||||
| Source[27] | ||||||
European Parliament elections results
2019 European Parliament election in Denmark
| Parties | Vote | |||||
|---|---|---|---|---|---|---|
| Votes | % | + / - | ||||
| Social Democrats | 8,703 | 27.01 | +3.97 | |||
| Venstre | 5,338 | 16.57 | +5.47 | |||
| Green Left | 4,324 | 13.42 | +3.43 | |||
| Danish People's Party | 4,099 | 12.72 | -19.37 | |||
| Social Liberals | 3,061 | 9.50 | +3.88 | |||
| Red–Green Alliance | 1,867 | 5.79 | New | |||
| Conservatives | 1,779 | 5.52 | -1.33 | |||
| People's Movement against the EU | 1,608 | 4.99 | -3.97 | |||
| The Alternative | 870 | 2.70 | New | |||
| Liberal Alliance | 575 | 1.78 | -0.57 | |||
| Total | 32,224 | |||||
| Source[28] | ||||||
2014 European Parliament election in Denmark
| Parties | Vote | |||||
|---|---|---|---|---|---|---|
| Votes | % | + / - | ||||
| Danish People's Party | 9,346 | 32.09 | +12.48 | |||
| Social Democrats | 6,709 | 23.04 | -1.64 | |||
| Venstre | 3,234 | 11.10 | -2.40 | |||
| Green Left | 2,910 | 9.99 | -6.47 | |||
| People's Movement against the EU | 2,608 | 8.96 | -0.54 | |||
| Conservatives | 1,994 | 6.85 | -2.82 | |||
| Social Liberals | 1,638 | 5.62 | +2.16 | |||
| Liberal Alliance | 684 | 2.35 | +1.83 | |||
| Total | 29,123 | |||||
| Source[29] | ||||||
2009 European Parliament election in Denmark
| Parties | Vote | |||||
|---|---|---|---|---|---|---|
| Votes | % | + / - | ||||
| Social Democrats | 7,221 | 24.68 | -7.41 | |||
| Danish People's Party | 5,736 | 19.61 | +12.14 | |||
| Green Left | 4,815 | 16.46 | +6.80 | |||
| Venstre | 3,948 | 13.50 | +0.27 | |||
| Conservatives | 2,828 | 9.67 | -4.94 | |||
| People's Movement against the EU | 2,780 | 9.50 | +3.45 | |||
| Social Liberals | 1,012 | 3.46 | -3.48 | |||
| June Movement | 762 | 2.60 | -6.71 | |||
| Liberal Alliance | 152 | 0.52 | New | |||
| Total | 29,254 | |||||
| Source[30] | ||||||
2004 European Parliament election in Denmark
| Parties | Vote | |||||
|---|---|---|---|---|---|---|
| Votes | % | + / - | ||||
| Social Democrats | 9,464 | 32.09 | +16.03 | |||
| Conservatives | 4,308 | 14.61 | +5.32 | |||
| Venstre | 3,903 | 13.23 | -4.88 | |||
| Green Left | 2,848 | 9.66 | +1.05 | |||
| June Movement | 2,747 | 9.31 | -8.39 | |||
| Danish People's Party | 2,203 | 7.47 | +0.65 | |||
| Social Liberals | 2,046 | 6.94 | -3.01 | |||
| People's Movement against the EU | 1,785 | 6.05 | -2.19 | |||
| Christian Democrats | 192 | 0.65 | -0.51 | |||
| Total | 29,496 | |||||
| Source[31] | ||||||
1999 European Parliament election in Denmark
| Parties | Vote | |||||
|---|---|---|---|---|---|---|
| Votes | % | + / - | ||||
| Venstre | 5,477 | 18.11 | +5.58 | |||
| June Movement | 5,352 | 17.70 | +0.26 | |||
| Social Democrats | 4,855 | 16.06 | +0.92 | |||
| Social Liberals | 3,009 | 9.95 | -0.09 | |||
| Conservatives | 2,809 | 9.29 | -9.59 | |||
| Green Left | 2,603 | 8.61 | -2.44 | |||
| People's Movement against the EU | 2,490 | 8.24 | -2.75 | |||
| Danish People's Party | 2,063 | 6.82 | New | |||
| Centre Democrats | 1,226 | 4.05 | +3.02 | |||
| Christian Democrats | 352 | 1.16 | +0.70 | |||
| Progress Party | 121 | 0.40 | -2.05 | |||
| Total | 30,236 | |||||
| Source[32] | ||||||
1994 European Parliament election in Denmark
| Parties | Vote | |||||
|---|---|---|---|---|---|---|
| Votes | % | + / - | ||||
| Conservatives | 5,930 | 18.88 | +5.42 | |||
| June Movement | 5,478 | 17.44 | New | |||
| Social Democrats | 4,755 | 15.14 | -7.30 | |||
| Venstre | 3,937 | 12.53 | +1.47 | |||
| Green Left | 3,471 | 11.05 | -0.21 | |||
| People's Movement against the EU | 3,453 | 10.99 | -14.17 | |||
| Social Liberals | 3,155 | 10.04 | +7.28 | |||
| Progress Party | 769 | 2.45 | -1.06 | |||
| Centre Democrats | 324 | 1.03 | -8.00 | |||
| Christian Democrats | 145 | 0.46 | -0.84 | |||
| Total | 31,417 | |||||
| Source[33] | ||||||
1989 European Parliament election in Denmark
| Parties | Vote | |||||
|---|---|---|---|---|---|---|
| Votes | % | + / - | ||||
| People's Movement against the EU | 6,790 | 25.16 | -2.43 | |||
| Social Democrats | 6,056 | 22.44 | +3.52 | |||
| Conservatives | 3,633 | 13.46 | -7.61 | |||
| Green Left | 3,039 | 11.26 | -2.46 | |||
| Venstre | 2,985 | 11.06 | +7.24 | |||
| Centre Democrats | 2,436 | 9.03 | +2.50 | |||
| Progress Party | 947 | 3.51 | +0.78 | |||
| Social Liberals | 745 | 2.76 | -0.27 | |||
| Christian Democrats | 352 | 1.30 | 0.00 | |||
| Total | 26,983 | |||||
| Source[34] | ||||||
1984 European Parliament election in Denmark
| Parties | Vote | |||||
|---|---|---|---|---|---|---|
| Votes | % | |||||
| People's Movement against the EU | 8,241 | 27.59 | ||||
| Conservatives | 6,292 | 21.07 | ||||
| Social Democrats | 5,649 | 18.92 | ||||
| Green Left | 4,096 | 13.72 | ||||
| Centre Democrats | 1,951 | 6.53 | ||||
| Venstre | 1,141 | 3.82 | ||||
| Social Liberals | 904 | 3.03 | ||||
| Progress Party | 814 | 2.73 | ||||
| Left Socialists | 389 | 1.30 | ||||
| Christian Democrats | 388 | 1.30 | ||||
| Total | 29,865 | |||||
| Source[35] | ||||||
Referendums
2022 Danish European Union opt-out referendum[36]
| Option | Votes | % |
|---|---|---|
| ✓ YES | 20,814 | 64.47 |
| X NO | 11,471 | 35.53 |
2015 Danish European Union opt-out referendum[37]
| Option | Votes | % |
|---|---|---|
| X NO | 20,678 | 57.59 |
| ✓ YES | 15,227 | 42.41 |
2014 Danish Unified Patent Court membership referendum[38]
| Option | Votes | % |
|---|---|---|
| ✓ YES | 16,330 | 57.15 |
| X NO | 12,242 | 42.85 |
2009 Danish Act of Succession referendum[39]
| Option | Votes | % |
|---|---|---|
| ✓ YES | 21,135 | 82.55 |
| X NO | 4,468 | 17.45 |
2000 Danish euro referendum[40]
| Option | Votes | % |
|---|---|---|
| X NO | 25,799 | 53.02 |
| ✓ YES | 22,864 | 46.98 |
1998 Danish Amsterdam Treaty referendum[41]
| Option | Votes | % |
|---|---|---|
| ✓ YES | 23,351 | 53.48 |
| X NO | 20,312 | 46.52 |
1993 Danish Maastricht Treaty referendum[42]
| Option | Votes | % |
|---|---|---|
| ✓ YES | 26,439 | 54.17 |
| X NO | 22,367 | 45.83 |
1992 Danish Maastricht Treaty referendum[43]
| Option | Votes | % |
|---|---|---|
| X NO | 25,133 | 52.76 |
| ✓ YES | 22,500 | 47.24 |
1986 Danish Single European Act referendum[44]
| Option | Votes | % |
|---|---|---|
| X NO | 22,721 | 53.70 |
| ✓ YES | 19,588 | 46.30 |
1972 Danish European Communities membership referendum[45]
| Option | Votes | % |
|---|---|---|
| ✓ YES | 21,950 | 53.17 |
| X NO | 19,330 | 46.83 |
References
- ↑ "Ballerupkredsen". kmdvalg.dk (in Danish). Retrieved 2023-06-08.
- ↑ "Forslag til Lov om ændring af lov om valg til Folketinget" (PDF). Folketingstidende. 4 June 1970.
- ↑ "Nye valgkredse fordeler stemmerne anderledes". dr.dk (in Danish). Retrieved 2023-06-08.
- ↑ "Beretning om nye valgkredse som følge af kommunalreformen" (in Danish). Retrieved 2023-06-08.
- ↑ "Det danske valgsystem: Valg til Folketinget". valg.im (in Danish). Retrieved 2023-06-08.
- ↑ "20 Ballerup". dataforsyningen.dk (in Danish). Retrieved 2023-06-08.
- ↑ "Forslag til Lov om ændring af lov om valg til Folketinget" (PDF). Folketingstidende. 4 June 1970.
- ↑ "Valgresultater fra tidligere valg:". kmdvalg (in Danish). Retrieved 2023-06-08.
- ↑ "FOLKETINGSVALG TIRSDAG 1. NOVEMBER 2022". valg.im (in Danish). Retrieved 2023-06-27.
- ↑ "FOLKETINGSVALG ONSDAG 5. JUNI 2019". valg.im (in Danish). Retrieved 2023-06-27.
- ↑ "FOLKETINGSVALG TORSDAG 18. JUNI 2015". valg.im (in Danish). Retrieved 2023-06-27.
- ↑ "FOLKETINGSVALG TORSDAG 15. SEPTEMBER 2011". valg.im (in Danish). Retrieved 2023-06-27.
- ↑ "Folketingsvalget den 13. november 2007". valg.im (in Danish). Retrieved 2023-06-27.
- ↑ "valg2005.book" (PDF). valg.im (in Danish). Retrieved 2023-06-27.
- ↑ "BMTABEL" (PDF). valg.im (in Danish). Retrieved 2023-06-27.
- ↑ "VALG98" (PDF). valg.im (in Danish). Retrieved 2023-06-27.
- ↑ "VALG94" (PDF). valg.im (in Danish). Retrieved 2023-06-27.
- ↑ "VALG90" (PDF). valg.im (in Danish). Retrieved 2023-06-27.
- ↑ "Folketingsvalget den 10. maj 1988". valg.im (in Danish). Retrieved 2023-06-27.
- ↑ "Folketingsvalget den 8.september 1987". dst.dk (in Danish). Retrieved 2023-06-27.
- ↑ "Folketingsvalget den 10. januar 1984". dst.dk (in Danish). Retrieved 2023-06-27.
- ↑ "Folketingsvalget den 8. december 1981". dst.dk (in Danish). Retrieved 2023-06-27.
- ↑ "Folketingsvalget den 23. oktober 1979". dst.dk (in Danish). Retrieved 2023-06-27.
- ↑ "Folketingsvalget den 15. februar 1977". dst.dk (in Danish). Retrieved 2023-06-27.
- ↑ "Folketingsvalget den 9. januar 1975". dst.dk (in Danish). Retrieved 2023-06-27.
- ↑ "Folketingsvalget den 4. december 1973". dst.dk (in Danish). Retrieved 2023-06-27.
- ↑ "Folketingsvalget den 21. september 1971 samt folkeafstemningen". dst.dk (in Danish). Retrieved 2023-06-27.
- ↑ "EUROPA-PARLAMENTSVALG SØNDAG 26. MAJ 2019". dst.dk (in Danish). Retrieved 2023-07-01.
- ↑ "EUROPA-PARLAMENTSVALG SØNDAG 25. MAJ 2014". dst.dk (in Danish). Retrieved 2023-07-01.
- ↑ "EUROPA-PARLAMENTSVALG SØNDAG 7. JUNI 2009". dst.dk (in Danish). Retrieved 2023-07-01.
- ↑ "EUROPA-PARLAMENTSVALGET DEN 13. JUNI 2004" (PDF). im.dk (in Danish). Retrieved 2023-07-01.
- ↑ "VALGET TIL EUROPA-PARLAMENTET DEN 10. JUNI 1999" (PDF). im.dk (in Danish). Retrieved 2023-07-01.
- ↑ "VALGET TIL EUROPA-PARLAMENTET DEN 9. JUNI 1994" (PDF). im.dk (in Danish). Retrieved 2023-07-01.
- ↑ "Valget til Europa-parlamentet den 15. juni 1989". dst.dk (in Danish). Retrieved 2023-07-01.
- ↑ "Valget til Europa-Parlamentet den 14. juni 1984". dst.dk (in Danish). Retrieved 2023-07-01.
- ↑ "FOLKEAFSTEMNING ONSDAG 1. JUNI 2022". dst.dk (in Danish). Retrieved 2023-07-05.
- ↑ "FOLKEAFSTEMNING TORSDAG 3. DECEMBER 2015". dst.dk (in Danish). Retrieved 2023-07-05.
- ↑ "FOLKEAFSTEMNING SØNDAG 25. MAJ 2014". dst.dk (in Danish). Retrieved 2023-07-05.
- ↑ "FOLKEAFSTEMNING SØNDAG 7. JUNI 2009". dst.dk (in Danish). Retrieved 2023-07-05.
- ↑ "FOLKEAFSTEMNINGEN DEN 28. SEPTEMBER 2000 OM DANMARKS DELTAGELSE I DEN FÆLLES VALUTA" (PDF). valg.im (in Danish). Retrieved 2023-07-05.
- ↑ "FOLKEAFSTEMNINGEN DEN 28. MAJ 1998OM DANMARKS TILTRÆDELSE AF AMSTERDAMTRAKTATEN" (PDF). valg.im (in Danish). Retrieved 2023-07-05.
- ↑ "FOLKEAFSTEMNINGEN DEN 18. MAJ 1993 OM DANMARKS TILTRÆDELSE AF EDINBURGH-AFGØRELSEN OG MAASTRICHT-TRAKTATEN". dst.dk (in Danish). Retrieved 2023-07-05.
- ↑ "Folkeafstemningen den 1. juni 1992 om Danmarks tiltrædelse af traktaten om Den Europæiske Union". dst.dk (in Danish). Retrieved 2023-07-05.
- ↑ "Vejledende folkeafstemning torsdag den 27. februar 1986 om Danmarks tiltrædelse af EF- pakken". dst.dk (in Danish). Retrieved 2023-07-05.
- ↑ "Folkeafstemningen om Danmarks tiltrædelse af De europæiske Fælleskaber 2. oktober 1972". dst.dk (in Danish). Retrieved 2023-07-05.