| |||||||||||||||||||||||||||||||||||||||||||||||||||||||||||||||||||||||||||||||||||||
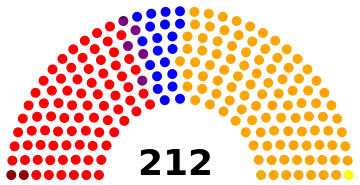
212 seats in the Chamber of Representatives | |||||||||||||||||||||||||||||||||||||||||||||||||||||||||||||||||||||||||||||||||||||
|---|---|---|---|---|---|---|---|---|---|---|---|---|---|---|---|---|---|---|---|---|---|---|---|---|---|---|---|---|---|---|---|---|---|---|---|---|---|---|---|---|---|---|---|---|---|---|---|---|---|---|---|---|---|---|---|---|---|---|---|---|---|---|---|---|---|---|---|---|---|---|---|---|---|---|---|---|---|---|---|---|---|---|---|---|---|
| |||||||||||||||||||||||||||||||||||||||||||||||||||||||||||||||||||||||||||||||||||||
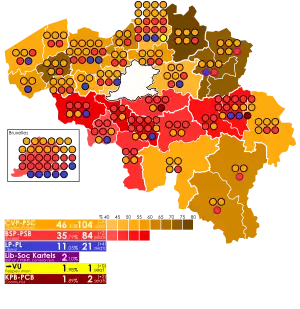
 Chamber seat distribution by constituency | |||||||||||||||||||||||||||||||||||||||||||||||||||||||||||||||||||||||||||||||||||||
| |||||||||||||||||||||||||||||||||||||||||||||||||||||||||||||||||||||||||||||||||||||
 |
|---|
|
|
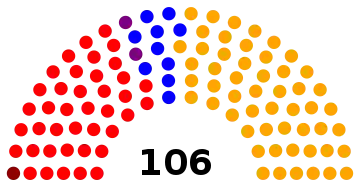
General elections were held in Belgium on 1 June 1958.[1] The result was a victory for the Christian Social Party, which won 104 of the 212 seats in the Chamber of Representatives and 53 of the 106 seats in the Senate.[2] Voter turnout was 93.6% in the Chamber election and 93.7% in the Senate election.[3] Elections for the nine provincial councils were also held.
The election took place in a political crisis known as the Second School War. The outgoing anti-clerical "purple" government of the Socialist and Liberal Party, led by Achille Van Acker, reversed policies of the previous Catholic-led government regarding private schools. The Van Acker government lost the election, leading again to a Catholic government led by Gaston Eyskens. That government, which was a few seats short of a majority in the Chamber, would be the last single-party government in Belgian history. Later in 1958, the School War was ended by a cross-party agreement and the Liberal Party joined the government.
Results
Chamber of Deputies
 | |||||
|---|---|---|---|---|---|
| Party | Votes | % | Seats | +/– | |
| Christian Social Party | 2,465,549 | 46.50 | 104 | +9 | |
| Belgian Socialist Party | 1,897,646 | 35.79 | 80 | –2 | |
| Liberal Party | 585,999 | 11.05 | 20 | –4 | |
| Liberal–Socialist Kartels | 111,284 | 2.10 | 5 | 0 | |
| People's Union | 104,823 | 1.98 | 1 | New | |
| Communist Party of Belgium | 100,145 | 1.89 | 2 | –2 | |
| Other parties | 36,907 | 0.70 | 0 | – | |
| Total | 5,302,353 | 100.00 | 212 | 0 | |
| Valid votes | 5,302,353 | 95.11 | |||
| Invalid/blank votes | 272,774 | 4.89 | |||
| Total votes | 5,575,127 | 100.00 | |||
| Registered voters/turnout | 5,954,858 | 93.62 | |||
| Source: Nohlen & Stöver | |||||
Senate
 | |||||
|---|---|---|---|---|---|
| Party | Votes | % | Seats | +/– | |
| Christian Social Party | 2,478,153 | 47.12 | 53 | +4 | |
| Belgian Socialist Party | 1,886,242 | 35.87 | 40 | –2 | |
| Liberal Party | 574,230 | 10.92 | 10 | –1 | |
| Liberal–Socialist Kartels | 111,299 | 2.12 | 2 | 0 | |
| Communist Party of Belgium | 100,788 | 1.92 | 1 | –1 | |
| People's Union | 84,364 | 1.60 | 0 | 0 | |
| Democratic Party | 23,953 | 0.46 | 0 | – | |
| Independents | 0 | – | |||
| Total | 5,259,029 | 100.00 | 106 | 0 | |
| Valid votes | 5,259,029 | 94.26 | |||
| Invalid/blank votes | 320,096 | 5.74 | |||
| Total votes | 5,579,125 | 100.00 | |||
| Registered voters/turnout | 5,954,858 | 93.69 | |||
| Source: Nohlen & Stöver, Belgian Elections | |||||
References
- ↑ Dieter Nohlen & Philip Stöver (2010) Elections in Europe: A data handbook, p289 ISBN 978-3-8329-5609-7
- ↑ Nohlen & Stöver, pp309-311
- ↑ Nohlen & Stöver, p291
.jpg.webp)
