| |||||||||||||||||||||||||||||||||||||||||||||||||||||||||||||||||||||||||||||||||||||
212 seats in the Chamber of Representatives | |||||||||||||||||||||||||||||||||||||||||||||||||||||||||||||||||||||||||||||||||||||
|---|---|---|---|---|---|---|---|---|---|---|---|---|---|---|---|---|---|---|---|---|---|---|---|---|---|---|---|---|---|---|---|---|---|---|---|---|---|---|---|---|---|---|---|---|---|---|---|---|---|---|---|---|---|---|---|---|---|---|---|---|---|---|---|---|---|---|---|---|---|---|---|---|---|---|---|---|---|---|---|---|---|---|---|---|---|
| |||||||||||||||||||||||||||||||||||||||||||||||||||||||||||||||||||||||||||||||||||||
 Results by constituency for the Chamber of Representatives | |||||||||||||||||||||||||||||||||||||||||||||||||||||||||||||||||||||||||||||||||||||
| |||||||||||||||||||||||||||||||||||||||||||||||||||||||||||||||||||||||||||||||||||||
 |
|---|
|
|
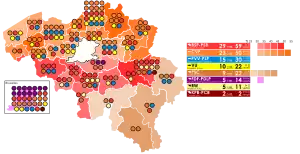
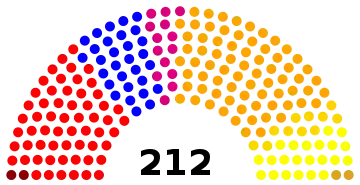
General elections were held in Belgium on 10 March 1974.[1] The Belgian Socialist Party emerged as the largest faction in the Chamber of Representatives with 59 of the 212 seats. Voter turnout was 90.3%.[2] Elections were also held for the nine provincial councils, as well as for the Council of the German Cultural Community for the first time.
Results
Chamber of Representatives
 | |||||
|---|---|---|---|---|---|
| Party | Votes | % | Seats | +/– | |
| Belgian Socialist Party | 1,314,796 | 25.00 | 59 | +2 | |
| Christian People's Party | 1,222,646 | 23.25 | 50 | +10 | |
| Party for Freedom and Progress | 798,818 | 15.19 | 30 | +4 | |
| People's Union | 536,287 | 10.20 | 22 | +1 | |
| Christian Social Party | 478,209 | 9.09 | 22 | +7 | |
| FDF–PDLP | 301,303 | 5.73 | 14 | New | |
| Walloon Rally | 269,455 | 5.12 | 11 | −1 | |
| Communist Party of Belgium | 107,481 | 2.04 | 2 | New | |
| BSP–Red Lions | 86,929 | 1.65 | 0 | New | |
| Democratic and Progressive Union | 58,527 | 1.11 | 2 | +2 | |
| All Power to the Workers | 19,794 | 0.38 | 0 | New | |
| United Feminist Party | 18,511 | 0.35 | 0 | New | |
| Party for the Middle Classes and Independents | 9,184 | 0.17 | 0 | New | |
| Party of German-speaking Belgians | 8,700 | 0.17 | 0 | New | |
| Walloon Liberal Party | 6,846 | 0.13 | 0 | New | |
| FDP | 4,729 | 0.09 | 0 | New | |
| Democratic and Progressive Union–New Democracy | 3,623 | 0.07 | 0 | New | |
| Rex Fr | 2,764 | 0.05 | 0 | New | |
| Return to Liège | 1,810 | 0.03 | 0 | New | |
| Kaganovemus | 1,678 | 0.03 | 0 | 0 | |
| SAP | 1,445 | 0.03 | 0 | New | |
| Diependale | 1,229 | 0.02 | 0 | New | |
| A74 | 979 | 0.02 | 0 | New | |
| PRS | 905 | 0.02 | 0 | New | |
| Zwartberg | 665 | 0.01 | 0 | New | |
| Trotskyists | 645 | 0.01 | 0 | New | |
| Belgian Radical Union | 389 | 0.01 | 0 | New | |
| PUR | 184 | 0.00 | 0 | New | |
| Total | 5,258,531 | 100.00 | 212 | 0 | |
| Valid votes | 5,258,531 | 92.07 | |||
| Invalid/blank votes | 453,108 | 7.93 | |||
| Total votes | 5,711,639 | 100.00 | |||
| Registered voters/turnout | 6,323,027 | 90.33 | |||
| Source: Belgian Elections | |||||
Senate
 | |||||
|---|---|---|---|---|---|
| Party | Votes | % | Seats | +/– | |
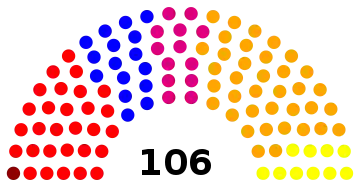
| Belgian Socialist Party | 1,301,722 | 25.11 | 27 | New | |
| Christian People's Party | 1,219,811 | 23.53 | 27 | New | |
| Party for Freedom and Progress | 755,694 | 14.58 | 16 | +1 | |
| FDF–RW–PDLP | 589,553 | 11.37 | 13 | New | |
| People's Union | 545,215 | 10.52 | 10 | New | |
| Christian Social Party | 430,512 | 8.30 | 10 | New | |
| Communist Party of Belgium | 115,007 | 2.22 | 1 | 0 | |
| BSP–Red Lions | 82,959 | 1.60 | 2 | +2 | |
| Democratic and Progressive Union | 60,400 | 1.16 | 0 | 0 | |
| Party for Freedom and Progress (Wallonia) | 21,782 | 0.42 | 0 | New | |
| All Power to the Workers | 16,744 | 0.32 | 0 | New | |
| Party of German-speaking Belgians | 15,624 | 0.30 | 0 | New | |
| United Feminist Party | 11,910 | 0.23 | 0 | New | |
| Party for the Middle Classes and Independents | 5,918 | 0.11 | 0 | New | |
| Iependael | 2,784 | 0.05 | 0 | New | |
| Zwartberg | 2,149 | 0.04 | 0 | New | |
| Kaganovemus | 1,903 | 0.04 | 0 | 0 | |
| PMO–Belgian Radical Union | 1,078 | 0.02 | 0 | New | |
| A74 | 942 | 0.02 | 0 | New | |
| Walloon Liberal Party | 597 | 0.01 | 0 | New | |
| PUR | 156 | 0.00 | 0 | New | |
| Other parties | 2,255 | 0.04 | 0 | – | |
| Total | 5,184,715 | 100.00 | 106 | 0 | |
| Valid votes | 5,184,715 | 90.77 | |||
| Invalid/blank votes | 527,014 | 9.23 | |||
| Total votes | 5,711,729 | 100.00 | |||
| Registered voters/turnout | 6,323,027 | 90.33 | |||
| Source: Belgian Elections | |||||
Council of the German Cultural Community
In this election, the new Council of the German Cultural Community (Rat der deutschen Kulturgemeinschaft) was directly elected for the first time; members of the council had been appointed a year earlier. The council is the precursor to the Parliament of the German-speaking Community.
| Party | Votes | % | Seats | +/– | |
|---|---|---|---|---|---|
| Christian Social Party | 46.90 | 12 | –1 | ||
| Party of German-speaking Belgians | 25.40 | 6 | +3 | ||
| Partei für Freiheit und Fortschritt | 14.90 | 4 | –2 | ||
| Belgian Socialist Party | 12.10 | 3 | 0 | ||
| Other parties | 15.10 | 0 | – | ||
| Total | 25 | 0 | |||
| Source: PDG | |||||
References
- ↑ Dieter Nohlen & Philip Stöver (2010) Elections in Europe: A data handbook, p289 ISBN 978-3-8329-5609-7
- ↑ Nohlen & Stöver, p291
This article is issued from Wikipedia. The text is licensed under Creative Commons - Attribution - Sharealike. Additional terms may apply for the media files.


