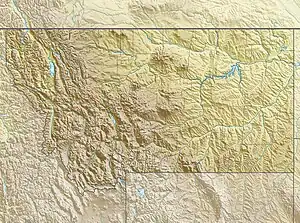
| Big Baldy Mountain | |
|---|---|
| Mount Baldy | |
 Big Baldy Mountain | |
| Highest point | |
| Elevation | 9,181 ft (2,798 m) NAVD 88[1] |
| Prominence | 3,557 ft (1,084 m)[2] |
| Coordinates | 46°58′06″N 110°36′23″W / 46.968450642°N 110.606280975°W[1] |
| Geography | |
| Location | Judith Basin County, Montana, U.S. |
| Parent range | Little Belt Mountains |
| Topo map | USGS Yogo Peak |
Big Baldy Mountain is the tallest mountain in the Little Belt Mountains located in Judith Basin County, Montana. The mountain is 9,181 feet (2,798 m) high. The mountain is locally known as Mount Baldy.
History
Several people in the area around the mountain, including some scientists, believe that Big Baldy Mountain including nearby mountain ranges were formed from magma that never made it to the earth's surface several thousands of years ago. Even though evidence is slim at the summit of Big Baldy itself, satellite views of the mountain show noticeable craters and features that indicate possible volcanic activity. Many features such as craters, lakes at the summit of the mountain, and stains that look like an old lava trail or spill make the mountain look as if it were a volcano many years ago. It is believed that when the Rocky Mountains were forming from plate tectonics, the Little Belt Mountains underwent a period of being subjected to magma moving close to the surface in which created several intrusions on the surface. A theory suggests that a bulge of volcanic magma and gases began to raise the surface that is now Big Baldy Mountain. The magma never exactly reached the surface, but some volcanic gases did, which created the sunken craters on the mountain after the magma disappeared from below the surface. The bulge remained, creating Big Baldy Mountain, and due to the way it was created, no vegetation is present on the top of the mountain; which is possibly where the name of the mountain came from.[3][4]
Climate
| Climate data for Big Baldy Mountain 46.9749 N, 110.5998 W, Elevation: 9,006 ft (2,745 m) (1991–2020 normals) | |||||||||||||
|---|---|---|---|---|---|---|---|---|---|---|---|---|---|
| Month | Jan | Feb | Mar | Apr | May | Jun | Jul | Aug | Sep | Oct | Nov | Dec | Year |
| Mean daily maximum °F (°C) | 23.6 (−4.7) |
23.8 (−4.6) |
29.7 (−1.3) |
35.5 (1.9) |
44.3 (6.8) |
53.1 (11.7) |
64.1 (17.8) |
63.8 (17.7) |
54.2 (12.3) |
40.0 (4.4) |
28.6 (−1.9) |
22.5 (−5.3) |
40.3 (4.6) |
| Daily mean °F (°C) | 15.8 (−9.0) |
14.8 (−9.6) |
19.8 (−6.8) |
25.1 (−3.8) |
33.7 (0.9) |
42.0 (5.6) |
51.5 (10.8) |
51.2 (10.7) |
42.5 (5.8) |
30.6 (−0.8) |
21.0 (−6.1) |
15.1 (−9.4) |
30.3 (−1.0) |
| Mean daily minimum °F (°C) | 8.0 (−13.3) |
5.9 (−14.5) |
9.9 (−12.3) |
14.8 (−9.6) |
23.1 (−4.9) |
30.8 (−0.7) |
38.9 (3.8) |
38.6 (3.7) |
30.7 (−0.7) |
21.2 (−6.0) |
13.5 (−10.3) |
7.7 (−13.5) |
20.3 (−6.5) |
| Average precipitation inches (mm) | 3.52 (89) |
3.34 (85) |
3.49 (89) |
4.37 (111) |
4.34 (110) |
4.69 (119) |
2.27 (58) |
2.43 (62) |
2.21 (56) |
3.18 (81) |
3.75 (95) |
3.69 (94) |
41.28 (1,049) |
| Source: PRISM Climate Group[5] | |||||||||||||
References
- 1 2 "Neihart 2". NGS Data Sheet. National Geodetic Survey, National Oceanic and Atmospheric Administration, United States Department of Commerce. Retrieved 2013-01-29.
- ↑ "Big Baldy Mountain". Peakbagger.com. Retrieved 2013-01-29.
- ↑ "Rocky Mountains". Cascades Volcano Observatory, U.S. Geological Survey. Archived from the original on 2013-03-02. Retrieved 2013-01-09.
- ↑ "Montana". Cascades Volcano Observatory, U.S. Geological Survey. Archived from the original on 2013-03-01. Retrieved 2013-01-09.
- ↑ "PRISM Climate Group, Oregon State University". PRISM Climate Group, Oregon State University. Retrieved October 4, 2023.
To find the table data on the PRISM website, start by clicking Coordinates (under Location); copy Latitude and Longitude figures from top of table; click Zoom to location; click Precipitation, Minimum temp, Mean temp, Maximum temp; click 30-year normals, 1991-2020; click 800m; click Retrieve Time Series button.