| ||||||||||||||||||||||||||||
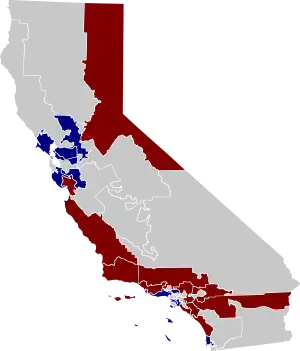
20 seats from odd-numbered districts | ||||||||||||||||||||||||||||
|---|---|---|---|---|---|---|---|---|---|---|---|---|---|---|---|---|---|---|---|---|---|---|---|---|---|---|---|---|
| ||||||||||||||||||||||||||||
 Electoral results by State Senate district | ||||||||||||||||||||||||||||
| ||||||||||||||||||||||||||||
| Elections in California |
|---|
 |
The 2008 California State Senate elections took place on November 4, 2008. Voters in California's odd-numbered State Senate districts, a total of 20, voted for their state senators. No seats changed parties and the Democratic Party maintained its 25-seat majority, while the Republican Party held 15 seats. Other elections also took place in California on November 4.
Only a single State Senate district, the 19th, was considered truly competitive by political analysts.[1]
Overview
| California State Senate elections, 2008[2][3] | |||||||
|---|---|---|---|---|---|---|---|
| Party | Votes | Percentage | Seats up |
Seats not up |
Total seats |
+/– | |
| Democratic | 3,786,204 | 55.06% | 11 | 14 | 25 | 0 | |
| Republican | 2,837,361 | 41.27% | 9 | 6 | 15 | 0 | |
| Independent | 131,248 | 1.91% | 0 | 0 | 0 | 0 | |
| Libertarian | 94,132 | 1.37% | 0 | 0 | 0 | 0 | |
| Peace and Freedom | 26,996 | 0.39% | 0 | 0 | 0 | 0 | |
| Totals | 6,875,941 | 100.00% | 20 | 20 | 40 | — | |
| Voter turnout | 72.60% | ||||||
Composition
| 2007–2008 State Senate | 2009–2010 State Senate | |||||||||||||||||||||||||||||||||||||||||||||||||||||||||
|---|---|---|---|---|---|---|---|---|---|---|---|---|---|---|---|---|---|---|---|---|---|---|---|---|---|---|---|---|---|---|---|---|---|---|---|---|---|---|---|---|---|---|---|---|---|---|---|---|---|---|---|---|---|---|---|---|---|---|
| ||||||||||||||||||||||||||||||||||||||||||||||||||||||||||
Results
The following candidates are the official results from the California Secretary of State.[2][3]
|
District 1 • District 3 • District 5 • District 7 • District 9 • District 11 • District 13 • District 15 • District 17 • District 19 • District 21 • District 23 • District 25 • District 27 • District 29 • District 31 • District 33 • District 35 • District 37 • District 39 |
District 1
| Party | Candidate | Votes | % | |
|---|---|---|---|---|
| Republican | Dave Cox (incumbent) | 267,426 | 62.27 | |
| Democratic | Anselmo Chavez | 162,044 | 37.73 | |
| Total votes | 429,470 | 100.00 | ||
| Turnout | 75.31 | |||
| Republican hold | ||||
District 3
| Party | Candidate | Votes | % | |
|---|---|---|---|---|
| Democratic | Mark Leno | 326,755 | 80.21 | |
| Republican | Sashi McEntee | 80,617 | 19.79 | |
| Total votes | 407,372 | 100.00 | ||
| Turnout | 78.08 | |||
| Democratic hold | ||||
District 5
| Party | Candidate | Votes | % | |
|---|---|---|---|---|
| Democratic | Lois Wolk | 207,108 | 64.54 | |
| Republican | Greg Aghazarian | 113,778 | 35.46 | |
| Total votes | 320,886 | 100.00 | ||
| Turnout | 73.54 | |||
| Democratic hold | ||||
District 7
| Party | Candidate | Votes | % | |
|---|---|---|---|---|
| Democratic | Mark DeSaulnier | 256,311 | 66.54 | |
| Republican | Christian Amsberry | 128,878 | 33.46 | |
| Total votes | 385,189 | 100.00 | ||
| Turnout | 78.22 | |||
| Democratic hold | ||||
District 9
| Party | Candidate | Votes | % | |
|---|---|---|---|---|
| Democratic | Loni Hancock | 272,225 | 77.22 | |
| Republican | Claudia Bermudez | 53,299 | 15.12 | |
| Peace and Freedom | Marsha Feinland | 26,996 | 7.66 | |
| Total votes | 352,520 | 100.00 | ||
| Turnout | 70.50 | |||
| Democratic hold | ||||
District 11
| Party | Candidate | Votes | % | |
|---|---|---|---|---|
| Democratic | Joe Simitian (incumbent) | 272,154 | 74.82 | |
| Republican | Blair Nathan | 91,592 | 25.18 | |
| Total votes | 363,746 | 100.00 | ||
| Turnout | 76.37 | |||
| Democratic hold | ||||
District 13
| Party | Candidate | Votes | % | |
|---|---|---|---|---|
| Democratic | Elaine Alquist (incumbent) | 179,855 | 70.94 | |
| Republican | Shane Connolly | 57,033 | 22.49 | |
| Libertarian | John Webster | 16,659 | 6.57 | |
| Total votes | 253,547 | 100.00 | ||
| Turnout | 75.24 | |||
| Democratic hold | ||||
District 15
| Party | Candidate | Votes | % | |
|---|---|---|---|---|
| Republican | Abel Maldonado (incumbent) | 222,617 | 62.91 | |
| Independent | Jim Fitzgerald | 131,229 | 37.09 | |
| Total votes | 353,846 | 100.00 | ||
| Turnout | 74.71 | |||
| Republican hold | ||||
District 17
| Party | Candidate | Votes | % | |
|---|---|---|---|---|
| Republican | George Runner (incumbent) | 182,295 | 54.85 | |
| Democratic | Bruce McFarland | 150,060 | 45.15 | |
| Total votes | 332,355 | 100.00 | ||
| Turnout | 70.90 | |||
| Republican hold | ||||
District 19
| Party | Candidate | Votes | % | |
|---|---|---|---|---|
| Republican | Tony Strickland | 207,976 | 50.10 | |
| Democratic | Hannah-Beth Jackson | 207,119 | 49.90 | |
| Independent | Peter Diederich (write-in) | 14 | 0.00 | |
| Total votes | 415,109 | 100.00 | ||
| Turnout | 78.94 | |||
| Republican hold | ||||
District 21
| Party | Candidate | Votes | % | |
|---|---|---|---|---|
| Democratic | Carol Liu | 204,737 | 66.88 | |
| Republican | Teddy Choi | 77,525 | 25.33 | |
| Libertarian | Steve Myers | 23,842 | 7.79 | |
| Total votes | 306,104 | 100.00 | ||
| Turnout | 69.81 | |||
| Democratic hold | ||||
District 23
| Party | Candidate | Votes | % | |
|---|---|---|---|---|
| Democratic | Fran Pavley | 238,172 | 67.40 | |
| Republican | Rick Montaine | 96,274 | 27.25 | |
| Libertarian | Colin Goldman | 18,906 | 5.35 | |
| Total votes | 353,352 | 100.00 | ||
| Turnout | 70.91 | |||
| Democratic hold | ||||
District 25
| Party | Candidate | Votes | % | |
|---|---|---|---|---|
| Democratic | Roderick Wright | 179,654 | 71.90 | |
| Republican | Lydia Gutierrez | 70,199 | 28.10 | |
| Total votes | 249,853 | 100.00 | ||
| Turnout | 66.73 | |||
| Democratic hold | ||||
District 27
| Party | Candidate | Votes | % | |
|---|---|---|---|---|
| Democratic | Alan Lowenthal (incumbent) | 171,668 | 67.34 | |
| Republican | Allen Wood | 83,268 | 32.66 | |
| Total votes | 254,936 | 100.00 | ||
| Turnout | 67.36 | |||
| Democratic hold | ||||
District 29
| Party | Candidate | Votes | % | |
|---|---|---|---|---|
| Republican | Bob Huff | 178,155 | 54.37 | |
| Democratic | Joseph Lyons | 127,536 | 38.92 | |
| Libertarian | Jill Stone | 21,983 | 6.71 | |
| Total votes | 327,674 | 100.00 | ||
| Turnout | 69.66 | |||
| Republican hold | ||||
District 31
| Party | Candidate | Votes | % | |
|---|---|---|---|---|
| Republican | Robert Dutton (incumbent) | 186,191 | 58.70 | |
| Democratic | Ameenah Fuller | 130,973 | 41.29 | |
| Independent | Denise Sternberg (write-in) | 5 | 0.00 | |
| Total votes | 317,169 | 100.00 | ||
| Turnout | 70.43 | |||
| Republican hold | ||||
District 33
| Party | Candidate | Votes | % | |
|---|---|---|---|---|
| Republican | Mimi Walters | 219,068 | 58.11 | |
| Democratic | Gary Pritchard | 157,945 | 41.89 | |
| Total votes | 377,013 | 100.00 | ||
| Turnout | 69.46 | |||
| Republican hold | ||||
District 35
| Party | Candidate | Votes | % | |
|---|---|---|---|---|
| Republican | Tom Harman (incumbent) | 222,149 | 58.55 | |
| Democratic | Ginny Meyer | 157,271 | 41.45 | |
| Total votes | 379,420 | 100.00 | ||
| Turnout | 67.73 | |||
| Republican hold | ||||
District 37
| Party | Candidate | Votes | % | |
|---|---|---|---|---|
| Republican | John Benoit | 190,415 | 54.79 | |
| Democratic | Arthur Guerrero | 157,142 | 45.21 | |
| Total votes | 347,557 | 100.00 | ||
| Turnout | 72.48 | |||
| Republican hold | ||||
District 39
| Party | Candidate | Votes | % | |
|---|---|---|---|---|
| Democratic | Christine Kehoe (incumbent) | 227,475 | 65.21 | |
| Republican | Jeff Perwin | 108,606 | 31.13 | |
| Libertarian | Jesse Thomas | 12,742 | 3.65 | |
| Total votes | 348,823 | 100.00 | ||
| Turnout | 73.39 | |||
| Democratic hold | ||||
References
- ↑ Dayen, David (August 14, 2008). "The Calitics Target Book - The Drive For 2/3". Calitics. Archived from the original on November 27, 2008. Retrieved February 21, 2009.
- 1 2 "Statement of Vote: November 4, 2008, General Election" (PDF). California Secretary of State. December 15, 2008. Archived from the original (PDF) on October 18, 2012. Retrieved February 21, 2009.
- 1 2 "Report of Registration as of October 20, 2008: Registration by State Senate District" (PDF). California Secretary of State. October 31, 2008. Archived from the original (PDF) on March 25, 2009. Retrieved February 21, 2009.

