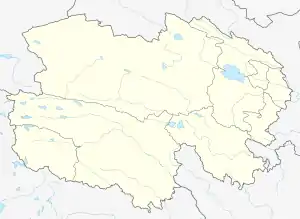
Chindu County
称多县 · ཁྲི་འདུ་རྫོང་། Chenduo, Chengduo | |
|---|---|
.png.webp) Chindu County (light red) within Yushu Prefecture (yellow) and Qinghai | |
 Chindu Location of the seat in Qinghai | |
| Coordinates: 33°22′N 97°07′E / 33.37°N 97.11°E | |
| Country | China |
| Province | Qinghai |
| Autonomous prefecture | Yushu |
| County seat | Chiwang Town |
| Area | |
| • Total | 15,300 km2 (5,900 sq mi) |
| Population (2020)[1] | |
| • Total | 57,159 |
| • Density | 3.7/km2 (9.7/sq mi) |
| Time zone | UTC+8 (China Standard) |
| Postal code | 815100 |
| Website | www |
| Chindu County | |||||||
|---|---|---|---|---|---|---|---|
| Chinese name | |||||||
| Simplified Chinese | 称多县 | ||||||
| Traditional Chinese | 稱多縣 | ||||||
| |||||||
| Tibetan name | |||||||
| Tibetan | ཁྲི་འདུ་རྫོང་། | ||||||
| |||||||
Chindu County (Tibetan: ཁྲི་འདུ་རྫོང་།) or Chenduo County (Chinese: 称多县) is a county of Qinghai Province, China, bordering Sichuan to the east. It is under the administration of Yushu Tibetan Autonomous Prefecture.
Administrative divisions
Chindu is divided to 5 towns and 2 townships.[2]
| Name | Simplified Chinese | Hanyu Pinyin | Tibetan | Wylie | Administrative division code | |
|---|---|---|---|---|---|---|
| Towns | ||||||
| Chiwang Town (Chengwen) |
称文镇 | Chēngwén Zhèn | ཁྲི་དབང་གྲོང་བརྡལ། | khri dbang grong brdal | 632723100 | |
| Xêwu Town (Xiewu) |
歇武镇 | Xiēwǔ Zhèn | བཞི་དབུས་གྲོང་རྡལ། | bzhi dbus grong rdal | 632723101 | |
| Zadoi Town (Zhaduo) |
扎朵镇 | Zhāduǒ Zhèn | རྫ་སྟོད་གྲོང་བརྡལ། | rdza stod grong brdal | 632723102 | |
| Domda Town (Qingshuihe) |
清水河镇 | Qīngshuǐhé Zhèn | སྡོམ་མདའ་གྲོང་རྡལ། | sdom mda' grong rdal | 632723103 | |
| Chainqên Town (Zhenqin) |
珍秦镇 | Zhēnqín Zhèn | དྲན་ཆེན་གྲོང་བརྡལ། | dran chen grong brdal | 632723104 | |
| Townships | ||||||
| Gadoi Township (Gaduo) |
尕朵乡 | Gǎduǒ Xiāng | སྒ་སྟོད་ཞང་། | sga stod zhang | 632723200 | |
| Lab Township (Labu) |
拉布乡 | Lābù Xiāng | ལབ་ཞང་། | lab zhang | 632723201 | |
Climate
Chindu County has a alpine climate (Köppen climate classification ETH). The average annual temperature in Chindu is −4.3 °C (24.3 °F). The average annual rainfall is 519.8 mm (20.46 in) with July as the wettest month. The temperatures are highest on average in July, at around 7.0 °C (44.6 °F), and lowest in January, at around −16.6 °C (2.1 °F).
| Climate data for Chindu (Domda Town), (1991–2020 normals, extremes 1981–2010) | |||||||||||||
|---|---|---|---|---|---|---|---|---|---|---|---|---|---|
| Month | Jan | Feb | Mar | Apr | May | Jun | Jul | Aug | Sep | Oct | Nov | Dec | Year |
| Record high °C (°F) | 9.4 (48.9) |
7.3 (45.1) |
12.2 (54.0) |
16.2 (61.2) |
19.3 (66.7) |
20.3 (68.5) |
22.5 (72.5) |
20.8 (69.4) |
19.2 (66.6) |
16.8 (62.2) |
8.9 (48.0) |
6.5 (43.7) |
22.5 (72.5) |
| Mean daily maximum °C (°F) | −5.8 (21.6) |
−3.2 (26.2) |
0.5 (32.9) |
4.8 (40.6) |
8.6 (47.5) |
11.7 (53.1) |
14.1 (57.4) |
13.9 (57.0) |
11.1 (52.0) |
4.8 (40.6) |
−0.6 (30.9) |
−4.2 (24.4) |
4.6 (40.3) |
| Daily mean °C (°F) | −16.3 (2.7) |
−13.1 (8.4) |
−8.6 (16.5) |
−3.0 (26.6) |
1.3 (34.3) |
5.1 (41.2) |
7.4 (45.3) |
6.7 (44.1) |
3.6 (38.5) |
−3.0 (26.6) |
−10.5 (13.1) |
−15.3 (4.5) |
−3.8 (25.2) |
| Mean daily minimum °C (°F) | −25.4 (−13.7) |
−22.1 (−7.8) |
−16.8 (1.8) |
−9.5 (14.9) |
−4.3 (24.3) |
0.1 (32.2) |
1.9 (35.4) |
1.1 (34.0) |
−1.3 (29.7) |
−8.3 (17.1) |
−18 (0) |
−24.3 (−11.7) |
−10.6 (13.0) |
| Record low °C (°F) | −41.2 (−42.2) |
−38.8 (−37.8) |
−36.6 (−33.9) |
−24.3 (−11.7) |
−15.6 (3.9) |
−10.3 (13.5) |
−6.6 (20.1) |
−10.9 (12.4) |
−14.7 (5.5) |
−29.5 (−21.1) |
−35.8 (−32.4) |
−41.9 (−43.4) |
−41.9 (−43.4) |
| Average precipitation mm (inches) | 8.3 (0.33) |
8.6 (0.34) |
14.2 (0.56) |
23.9 (0.94) |
57.9 (2.28) |
100.9 (3.97) |
102.2 (4.02) |
92.3 (3.63) |
76.3 (3.00) |
34.2 (1.35) |
6.2 (0.24) |
3.3 (0.13) |
528.3 (20.79) |
| Average precipitation days (≥ 0.1 mm) | 7.0 | 8.2 | 11.8 | 13.9 | 19.5 | 22.7 | 20.3 | 18.9 | 20.5 | 14.7 | 5.6 | 4.4 | 167.5 |
| Average snowy days | 9.1 | 10.1 | 14.9 | 16.4 | 20.8 | 11.4 | 3.4 | 3.7 | 12.5 | 17.1 | 7.6 | 6.1 | 133.1 |
| Average relative humidity (%) | 58 | 56 | 57 | 61 | 68 | 74 | 74 | 74 | 76 | 72 | 63 | 56 | 66 |
| Mean monthly sunshine hours | 205.6 | 188.7 | 221.3 | 232.9 | 225.4 | 185.2 | 210.6 | 203.8 | 180.7 | 211.7 | 224.5 | 221.4 | 2,511.8 |
| Percent possible sunshine | 65 | 60 | 59 | 59 | 52 | 43 | 48 | 50 | 49 | 61 | 73 | 72 | 58 |
| Source: China Meteorological Administration[3][4] | |||||||||||||
References
- ↑ "玉树州第七次全国人口普查公报(第二号)——市县级常住人口情况" (in Chinese). The Paper. 2021-06-30.
- ↑ "统计用区划代码 www.stats.gov.cn" (in Chinese). XZQH. Retrieved 2020-12-27.
- ↑ 中国气象数据网 – WeatherBk Data (in Simplified Chinese). China Meteorological Administration. Retrieved 27 September 2023.
- ↑ 中国气象数据网 (in Simplified Chinese). China Meteorological Administration. Retrieved 27 September 2023.
This article is issued from Wikipedia. The text is licensed under Creative Commons - Attribution - Sharealike. Additional terms may apply for the media files.