The spectrum of a chirp pulse describes its characteristics in terms of its frequency components. This frequency-domain representation is an alternative to the more familiar time-domain waveform, and the two versions are mathematically related by the Fourier transform. The spectrum is of particular interest when pulses are subject to signal processing. For example, when a chirp pulse is compressed by its matched filter, the resulting waveform contains not only a main narrow pulse but, also, a variety of unwanted artifacts many of which are directly attributable to features in the chirp's spectral characteristics.
A simple way to derive the spectrum of a chirp using a computers, is to sample the time-domain waveform at a frequency well above the Nyquist limit and use an FFT algorithm to obtain the desired result. As this approach was not an option for the early designers, they resorted to analytic analysis, or and to graphical or approximation methods. These early methods still remain helpful, however, as they give additional insight into the behavior and properties of chirps.
Chirp pulse
A general expression for an oscillatory waveform, centered on frequency ω0 is
where and θ(t) give the amplitude and phase variations of the waveform , with time.
The frequency spectrum of this waveform is obtained by calculating the Fourier Transform of , i.e.
so
In a few special cases, the integral can be solved to give an analytical expression, but often the characteristics of and θ(t) are such that the integral can only be evaluated by an approximation algorithm or by numerical integration.
Linear chirp
In the special case where s(t) is constrained to be an up-chirp, flat topped pulse with its instantaneous frequency varying as a linear function of time, then an analytical solution is possible.
For convenience, the pulse is considered to have unit amplitude and be of duration T, with the amplitude and phase defined over the time interval -T/2 to +T/2. The total frequency sweep is ΔF, varying in a linear manner from -ΔF/2 to +ΔF/2 in the defined time interval.
When the frequency is a linear function of time, the phase is a quadratic function, and s(t) can be written
The spectrum of this linear FM signal is
By completing the square and using the Fresnel integrals C(X) and S(X),[1]: 35 [2]: 300 defined by
the expression can be evaluated[3][4][5][6]: 138 [7] to give:
where and are given by
The linear FM spectrum can be considered to have three major components, namely
- an Amplitude Term,
- a Square Law Phase term,
- and a Residual Phase Term
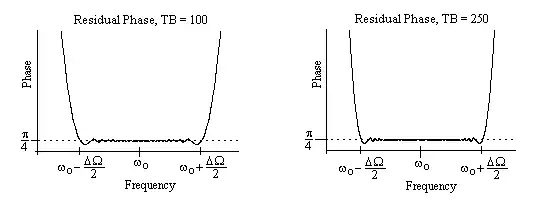
The ratio is approximately unity over a large part of frequency range of interest so Φ2 approximates to a constant phase angle π/4 there.
If a frequency scaling term n is introduced, where , then the expressions for the Fresnel arguments become
- and
The spectra are now functions of the product T.ΔF, independent of any particular values of center frequency and bandwidth. This product, T.ΔF, is often referred to as the time-bandwidth product of the chirp.
Tables of the Fresnel integrals have been published,[1]: 32–35 [2]: 321–322 together with mathematical routines with which to compute the integrals manually or by means of a computer program. In addition, a number of mathematical software programs, such as Mathcad, MATLAB and Mathematica have built-in routines to evaluate the integrals, either as standard functions or in extension packages.
Some plots of the power spectrum |S(ω)|2 as a function of frequency are shown, for time-bandwidth products of 25, 100, 250 and 1000. When the product is small, the Fresnel ripples are very much in evidence, but the spectrum does tend to a more rectangular profile for larger values.


In the case of the plots of residual phase, Φ2(ω), the profiles tend to be very similar over a wide range of time-bandwidth products. Two examples, for TxB = 100 and 250 are shown below. They have a phase angle close to a value of π/4 within the chirp range and they only start to change significantly for frequencies beyond this range.
Consequently, for frequencies within the sweep range of the chirp, it is the square-law phase term Φ1(ω) and its group delay function ( = -dΦ1/d(ω) ) that are of most interest. There is a plot of the group delay shown below. Both this function and the phase Φ1(ω) are independent of the value of the time-bandwidth product. As expected, the group delay is a linear function with a duration T secs, over a frequency sweep of ΔΩ rads.
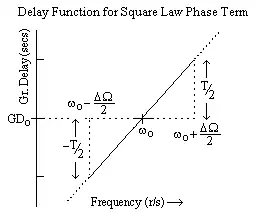
The residual phase term adds only minor perturbations to this characteristic within the frequency range . At frequencies outside this range, Φ2(ω) deviates rapidly from π/4, and so the total phase will deviate seriously from a square law there. Fortunately, the energy content of the chirp spectrum is very small at these frequencies (as is demonstrated in a later section).
Non-linear chirps
When the Frequency-Time characteristic is non-linear, the Fourier integral is difficult to evaluate. In such cases, it is possible to resort to an approximation method such as the stationary phase approximation, or to use numerical methods.
Via stationary phase method
Often (as in radar applications) a(t) is a slowly varying function of time and the phase θ(t) is oscillatory and varies rapidly, over the range of integration. With such waveforms, the stationary phase approximation can be used to investigate the spectrum.[6]: 34 [8][9][10] The method relies on the fact that the major contributions to the Fourier integral come from the region where the rate of change of phase is minimal, i.e. when
Unless θ(t) is a constant, the point in time ts at which the phase is stationary will vary according to the instantaneous frequency ωs.
Expressing the difference between (ωs-ω0).t and θ(t) as a Taylor series about the time ts, but discarding all but the first three terms (of which the second term is zero, here), the Fourier integral can be written, approximately, as
In this equation ts represents a constant time point, so terms depending on ts alone may be taken outside the integral. The expression simplifies to[6]: 39 [10]
so
where ωt is used to indicate the dependence of the frequency variable on t.
This is a very useful expression linking, as it does, the spectrum profile to the amplitude and phase characteristics of the chirp.
To carry out the inverse process, i.e. to find the time domain function s(t) given frequency domain data, the inverse Fourier transform is derived.
where Φ(x) is the phase function of the spectrum. The stationary phase points for this integrand are located at
and the corollary relationship, equivalent to that derived for the spectrum, can be obtained by the stationary phase method, and is
In effect, stationary phase analysis gives the following (approximate) Fourier pair relationships:[6]: 43
and
Consequently, approximate expressions for a(t) and θ(t) can be obtained when the spectrum, including its phase function Φ(ω) is given and, similarly, approximate expressions for |S(ω| and Φ(ω) can be obtained when the signal characteristics are given. Several examples of the procedure are given in the literature[6]: 43 [8][10]
Although the relationships are only approximate, their accuracy improves as the time-bandwidth product increases. In cases where the signal envelope and spectrum modulus are defined by smoothly varying Gaussian function then a T.ΔF product as low as 15 will give acceptable results, but if both a(t) and |S(ω)| are defined by rectangular functions, then the product T.ΔF needs to be much greater, typically over 100.[6]: 49
- Examples
Typically, in the radar case, a(t) is a constant over the duration of the signal and, for convenience, is assumed here to be unity. So the phase and amplitude characteristics, in the frequency domain, are related by
There are two solutions for Φ(ω), which are complex conjugates of each other. The two filters with these characteristics can be used as the transmitter and receiver filters of a radar system and are interchangeable.
The group delay characteristic D(ω), (where D(ω)=-dΦ/dω), is
so
So in the case of a rectangular time envelope, the dispersive delay characteristic is given by the integral of the square of the envelope.[10] If the positive sign is taken, then the group delay increases with increasing frequency and vice versa. The result is only approximate, but is more accurate for large values of the time bandwidth product.
Consider, as an example, the case of a spectrum that is uniform over the range -ωmax/2 to ωmax/2, then
so
Put D(-ωmax/2) = 0 and D(ωmax/2) = T, where T is the pulse duration, then K = T/2 and A = (2πT)/ωmax
so, finally
As expected, a flat topped frequency spectrum corresponds to a linear frequency sweep.
The linear chirp is just one special case which, in any case, can be calculated more precisely by the methods of the earlier section. The particular usefulness of the stationary phase method lies in its ability to provide results when the frequency sweep is non linear. In such cases the spectral response can be shaped to meet some desired design criteria, for example, low side-lobes when a chirp is compressed. One such family of spectral functions that has been studied[6]: 51 is given by
It is possible to find the group delay characteristics of these functions in a similar manner to that carried out above and the results for n = 1 to 4 have been calculated.[6]: 51
Although these cosine functions are amenable to mathematical manipulation, they are rarely chosen to define the spectral characteristics of a chirp, in practice, because when compressed they give broad main pulses with high side-lobe levels. A better characteristic (among many)[11] is the Hamming function, given by
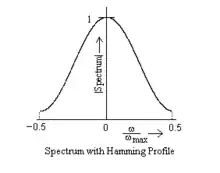
A plot of this characteristic is shown, plotted over the range -ωmax/2 to ωmax/2.
Applying the equations given above, the group delay characteristic which achieves this spectral shape can be obtained. It is
Now because the principle of stationary phase shows that there is a direct relationship between elapsed time and the instantaneous signal delay then, for the Hamming window, t/T can be related to ω/ωmax by
This characteristic which is time as a function of frequency is shown here. Inverting the plot gives the more usual (and more useful) plot of frequency as a function of time, which is also shown.
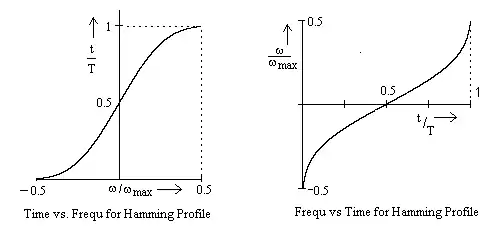
Other spectral shapes can be investigated in the same way and the results, although approximate, are surprisingly accurate, especially when the time bandwidth product of the pulse is high.
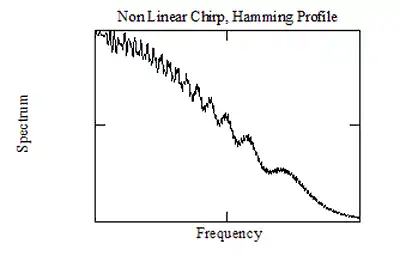
The stationary phase method does not predict or deal with Fresnell ripples, so it is unable to offer any means by which these ripples can be minimized. As an example, the figure below shows a chirp spectrum with T.ΔF =250 obtained for a non-linear chirp aiming to match the Hamming window, using the methods described above. The figure shows that the spectral profile matches the Hamming characteristic quite well, but Fresnell ripples, not predicted by the method, are very much in evidence.
Via numerical methods
Sampling
Whenever a Fourier integral cannot be evaluated by analytical means, an approximate solution is usually possible by numerical analysis. Such a procedure requires the function to be sampled, usually at equi-spaced intervals in time.
One consequence of sampling is that the resultant spectrum is periodic in the frequency domain. In addition to the (desired) baseband spectrum, additional versions of the spectrum occur, centered on multiples of the sampling frequency. To ensure that there is no overlapping of frequency data (i.e. no aliasing) the Nyquist sampling theorem must be satisfied. In practice, a sampling rate substantially higher than that dictated by the sampling theorem is advisable[12]: 11
Spectrum of a sampled Signal - the Fourier transform of a discrete time signal
A straightforward way to approximate an integral, such as a Fourier integral, is to use the standard 'rectangle rule' for numerical integration. The method assumes the signal value taken at a sample instant remains constant for one sampling interval, until the next sample is taken. This procedure is sometimes referred to as a 'box-car generator', or a zero order sample and hold.[13]: 114 [14]: 34 If the time interval between samples is W, then sn = s(nW), and the desired integral is obtained, approximately, by summing the rectangular areas.
The result so obtained is the convolution of a rectangular pulse with step size W with the impulses located at the sampling instants with weights equal to the sample values.[12]: 12 In consequence, the spectrum of interest will have superimposed upon it the frequency response of the sample and hold,[13]: 135 [14]: 36 and the spectrum of the sampled signal Ss is given by:[12]: 12
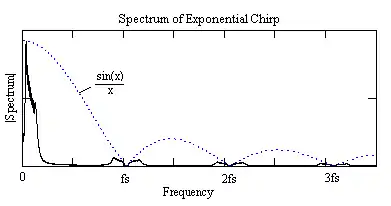
The first part of the expression, i.e. the 'sin(x)/x' part, is the frequency response of the sample and hold. Its amplitude decreases with frequency and it falls to 63% of its peak value at half the sampling frequency and it is zero at multiples of that frequency (since fs =1/W).
The second term in the equation is called the Fourier transform of the discrete signal sn.[12]: 12 [15] It is a continuous function over all ω and involves an infinite number of summations. In practice the summation process can be truncated to a finite number of samples, N, possibly because the waveform is periodic or zero outside the range of samples. Furthermore, because the same spectrum is endlessly repeated, it is possible to confine interest to spectral data within the range -ωs/2 to +ωs/2.
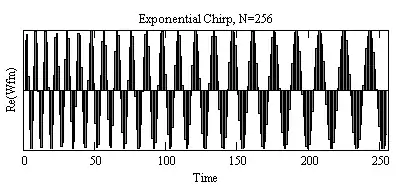
As an example, an exponential chirp (with its top frequency well below the Nyquist limit) is sampled at 256 points, as shown.
The sampled spectrum, Ss(ω) of this waveform, calculated using the equation given above, is shown. To simplify the plot, only the results at positive frequencies have been displayed. The influence of the frequency spectrum of the zero order hold circuit is clearly seen in the diagram.
The baseband portion of the spectrum is shown in more detail in the next figure and the response shows a distinct slope, being significantly lower at the higher frequencies.
.png.webp)
Although the characteristic of the zero order hold has a small influence on this result, the slope is mainly due to the properties of the chirp. The waveform sweeps relatively quickly over the high frequencies and spends more time sweeping the low frequencies, consequently there is less energy content at the high frequencies with more at the lower ones. (A linear chirp, on the other hand, has a nominally flat spectrum because its frequencies are swept at the same rate, as shown in some earlier plots).
Via the discrete Fourier transform
If we limit interest in the output spectrum to a finite number of discrete data points (= N), at frequencies ωm given by
then the formula for calculating the discrete Fourier transform is
The calculations can be carried out by means of a straightforward computer algorithm,[12]: 21 but this is not very efficient in computer usage. Consequently, more efficient algorithms have been developed, especially fast Fourier transforms (FFT). Computer programs which implement the FFT are widely available in the literature[12]: 54 [15]: 119, 412 [16] and in proprietary CAD programs such as Mathcad, MATLAB, and Mathematica.
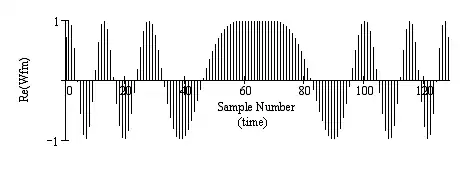
In the following example a linear chirp with time bandwidth product of 25 is sampled at 128 points (i.e. N = 128). In the figure samples of the real part of the waveform are shown - note that these are samples in the time domain. The FFT process assumes the waveform is cyclic, so these 128 data points can be considered to be part of an endlessly repeating sequence in time.
By calculating the N-point FFT of this data, the discrete spectrum of the sequence is obtained. The magnitude of this spectrum is shown in the attached figure, where these data points are samples in frequency. The data is cyclic so, in the plot, the zero frequency point is at n = 0 and also at n = 128 (i.e. both points are the same frequency). The point n = 64 corresponds to +fs/2 (and also to -fs/2).
.png.webp)
To display the spectrum in more detail (but not necessarily with more resolution[17]), the time sequence can be extended by zero padding.[15]: 80–85 [18][19] For example, extending the 128 point time sequence with zeros to give N = 4096 results in that part of the spectrum originally presented in 16 samples, now being presented in 512 samples, as shown.
.png.webp)
Spectral spread
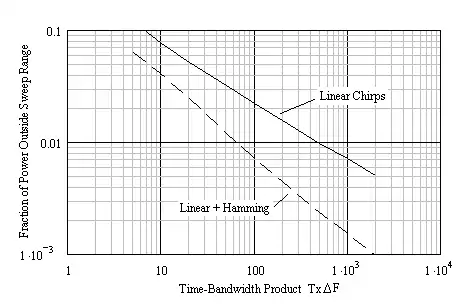
There is very little spectral content beyond the sweep frequency range of a chirp pulse and this is especially true for waveforms where the time-bandwidth product is large. The full line on the graph of the adjacent figure shows results for linear chirps. It shows, for example, that only about 2% of the total power resides at frequencies outside the sweep range ΔF when the time-bandwidth is 100, and it is less than 1/2% when T.ΔF is 500.
In the case of a non-linear chirp, or a linear chirp shaped by amplitude weighting, the fraction of power outside ΔF is even lower, as is shown on the graph, where the dashed line is for spectra with Hamming profiles.
This low spectral spread is particularly significant when baseband signals are to be digitized since it permits a sampling frequency to be chosen which is only slightly higher than twice the maximum frequency excursion of the chirp.
Reducing Spectral Ripple
The Fresnel ripples on a chirp spectrum are very obtrusive, especially when time-bandwidth products are low (under 50, say) and their presence leads to high time sidelobe levels when chirps are subject to pulse compression as in radar and sonar systems. They arise because of the sudden discontinuities in the chirp waveform at the commencement and termination of the pulse.
Although there are a number of procedures that can be applied to reduce the ripple levels, they are not all equally effective. Furthermore, some of the methods require amplitude shaping, or amplitude modulation, of the chirp pulse and this makes those methods unsuitable when, for example, the chirp pulses are to be transmitted by a power amplifier operating in a near-limiting condition. For such systems only the methods using frequency (or phase) pre-distortion are appropriate.
Introducing Rise and Fall Times of Finite Duration
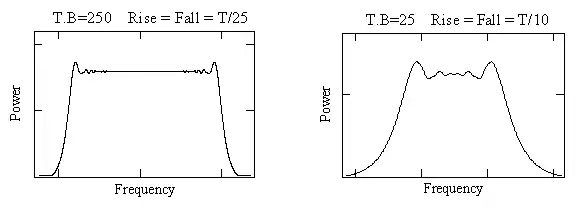
If the transitions at the start and end of the chirp are made less sudden (or more 'rounded'), then a reduction in ripple amplitude is achieved.[6]: 213 [20][21] The durations of the two transition regions need only be a small fraction of the pulse duration, and suggested values are between 2/ΔF and 3/ΔF [20] but, as expected, when the time-bandwidth product of the pulse is small, longer transition periods are needed. The actual profiles of these rise and fall regions of a pulse do not seem to be critical and may be provided, for example, by band limiting filters in analogue implementations and a linear slope in digital ones.
Two examples show the spectra of linear chirps with finite rise-times. The first is for a chirp with time-bandwidth of 250, where the rise and fall times are 4% of the total pulse duration and the second is for a chirp with time-bandwidth of 25, where the rise and fall times are 10% of the total. These two spectra show a marked reduction in ripple amplitude compared to the spectra of unmodified linear chirps shown earlier.
Applying Phase or Frequency Distortion to the Chirp Pulse
A analogous technique can be applied to the frequency characteristic of the chirp waveform by adding linear FM distortion segments (quadratic phase modulation distortion) to the frequency characteristic of the chirp, as shown. The method is effective because amplitude and phase distortions having functional similarity can produce similar effects when the distortion factors are small.[20][22]

This added distortion is referred to as 'predistortion'. Suggested values for these distortion regions, to achieve good results, were initially determined to be:
In 1988, later work[23] proposed slightly different values, namely:
The outcomes can be further improved by optimizing values for each particular situation.
Below are two plots showing the effects of frequency pre-correction, for time bandwidths of 25 and 250. These can be compared to the results in the earlier sections.
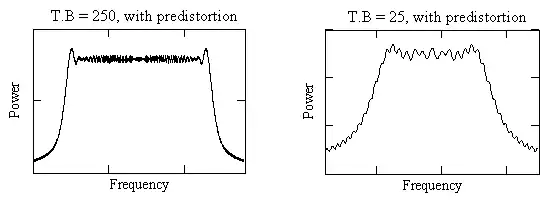
The ripple reduction achieved by frequency pre-correction, although significant, is seen to be less successful than that achieved by the amplitude modulation methods of the previous section. However, it has been suggested[21] that by implementing cubic (rather than quadratic) phase pre-correction, comparable results can be achieved.
Deriving a Waveform from a Target Frequency Spectrum
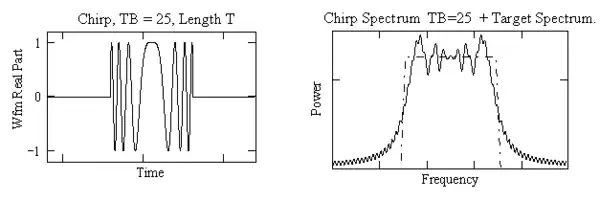
This method uses an inverse Fourier transform in order to derive a waveform which has a spectrum with the phase characteristic of a chosen chirp but a new amplitude profile which is rectangular and ripple free. The method is very effective but, unfortunately, the waveform that is so derived has a semi-infinite time duration. If, for convenience, the newly derived waveform is truncated to a practical length, then some ripple is reintroduced onto the spectrum.
As an example, a linear chirp waveform with a time bandwidth of 25 is shown together with its spectrum magnitude (shown by a full line) which, as demonstrated earlier, has a large ripple component. It is possible to find, by means of an inverse FFT, a chirp waveform which, in the frequency domain, has the same phase characteristic as before, but with the rectangular magnitude characteristic shown by the dashed line on the plot. The chirp waveform resulting from this process has a very long time duration, but when it is truncated to say, a length 2T, then the spectrum acquires some ripple once more, as shown.

Applying Window Functions
There are many applications in which a spectrum with a rectangular magnitude profile is not ideal. For example, when a chirp waveform is compressed by means of its matched filter, then the resultant waveform approximates to the sinc function and, consequently, has annoyingly high sidelobes. Often, to improve the characteristics of the pulse and lower the sidelobe levels, its spectrum is modified, typically to a bell-shaped profile. Similar problems arise in digital signal processing where the spectral shaping is provided by a window function, a process sometimes called apodization. In the case of an antenna array, similar profiling by "weighting functions" is used to reduce the spatial sidelobes of the radiation pattern.
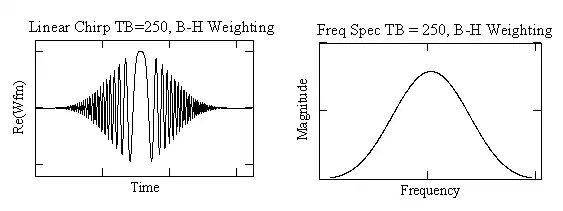
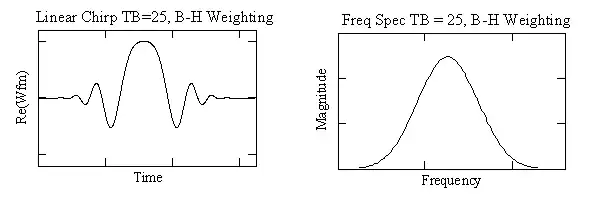
Although spectral shaping of a chirp could be applied in the frequency domain, better results are obtained if the shaping is carried out in the time domain.[24][25] Examples of this process are shown for linear chirps with time-bandwidth products of 250 and 25. They have been shaped by a 3-term Blackman-Harris window[11] given by
The spectra, now bell-shaped, are seen to be free of ripples.
Non-linear chirps can be devised that have a bell shaped spectrum, such as the Blackman-Harris window just discussed, and consequently will exhibit reduced ripple compared to the linear chirp. By means of the stationary phase method described earlier, an approximate relationship between time and frequency can be obtained:

Rearranging the equation, one can plot frequency against time, which looks roughly as shown to the right.
Non-linear chirps with spectral profiles of a Blackman-Harris window show ripple reduction, but can have disappointing performance due to amplitude profiles with fast rise and fall times.
As examples, below are two plots of the spectral magnitudes of such chirps, with time-bandwidth products of 250 and 25, respectively. These chirps have reduced energy content in their outer frequency regions, but still show less than ideal performance.

See also
- Pulse compression, a process which uses frequency or phase coded waveforms to improve the signal to noise of received signals.
- Chirp compression, a compression process for chirps only.
References
- 1 2 Jahnke E. and Emde F., "Tables of functions", Dover Publications N.Y. 1945
- 1 2 Abramowitz M. and Stegun I.A.,"Handbook of Mathematical Functions", Nat. Bur. Standards 1964, reprinted by Dover Publications N.Y. 1965 (9th ed.1972)
- ↑ Klauder J.R., Price A.C., Darlington S. and Albersheim W.J., The Theory and Design of Chirp Radars", The Bell system Technical Journal, Vol.39, July 1960 (pp.745-809)
- ↑ Chin J.E. and Cook C.E., The Mathematics of Pulse compression", Sperry Eng. Review, Vol.12, Oct 1959. (pp.11-16)
- ↑ Cook C.E., Pulse Compression - Key to More Efficient Radar Transmission",Proc.IRE, March 1960 (p.312)
- 1 2 3 4 5 6 7 8 9 Cook C.E. and Bernfeld M., "Radar Signals - An Introduction to Theory and Application", Academic Press 1967,1987, reprinted by Artech House 1993.
- ↑ Varhney L.R. and Thomas D.,"Sidelobe Reduction for Matched Filter range Processing", IEEE Radar Conference 2003
- 1 2 Fowle E.N., "The design of FM pulse compression signals", IEEE Trans. IT-10, 1964, (pp.61-67)
- ↑ Key E.L., Fowle E.N., Haggarty R.D.., "A method of pulse compression employing nonlinear frequency modulation", M.I.T. Lincoln Lab., Lexington, Mass., Tech. Rep. 207, 1959.
- 1 2 3 4 Key E.L., Fowle E.N., Haggarty R.D.., "A Method of Designing Signals of Large Time-Bandwidth Product", Proc. IRE Int. Con. Rec. Pt.4, March 1961 (pp.146-154)
- 1 2 Harris F.J., "On the Use of Windows for Harmonic Analysis with the Discrete Fourier Transform", Proc. IEEE Vol.66, Jan 1978
- 1 2 3 4 5 6 Burrus C.S. and Parks T.W., "DFT/FFT and Convolution Algorithms", Wiley & Sons, Interscience 1985.
- 1 2 Tou J.T., "Digital and Sampled-data Control Systems", McGraw-Hill N.Y. 1959
- 1 2 Ragazzini J.R. and Franklin G.F., "Sampled-Data Control Systems", McGraw-Hill N.Y. 1958
- 1 2 3 Stearns S.D. and Hush D.R., "Digital signal Analysis", Prentice-Hall, 1990 (p.61)
- ↑ Harris F.J. "Fast Fourier Transforms", San Diego State Univ. Cal. 1984
- ↑ Anon, "Zero Padding does not buy Spectral Resolution" National Instruments 2006, http://www.ni.comwhite-paper/4880/en/%5B%5D
- ↑ Harris F.J. "Signal Processing with Ones and Zeros and the FFT", San Diego State Univ., Cal. 1984
- ↑ Lyons R., "How to Interpolate in the Time Domain by Zero-Padding in the Frequency Domain", http://www.dspguru.com/dsp/how-to-interpolate-in-time-domain-by-zero-padding-inthe-frequency-domain
- 1 2 3 Cook C.E. & Paolillo J., "A Pulse Compression Predistortion Function for Efficient Sidelobe Reduction in a High-Power Radar", Proc. IEEE Vol.52, April 1964 (pp.377-384)
- 1 2 Kowatsch M. and Stocker H.R., "Effect of Fresnel ripples on sidelobe suppression in low time-bandwidth product linear FM pulse compression", IEE Proc. Vol. 129, Pf. F, No.1 Feb 1982
- ↑ Wheeler H.A., "The Interpretation of Amplitude and Phase Distortion in Terms of Paired Echoes", Proc. IRE, June 1939
- ↑ Solal M., "High Performance SAW Delay Lines for Low Time Bandwidth Using Periodically Sampled Transducers", Ultrasonics Symposium, IEEE, Nov. 1988.
- ↑ Judd G.W., "Technique for Realizing Low Time Sidelobe Levels in Small Compression Ratio Chirp Waveforms", Proc. IEEE Ultrasonics Symposium, 1973, pp.478-483
- ↑ McCue J.J.G., "A Note on the Hamming Weighting of Linear-FM Pulses", Proc. IEEE, Vol. 67, No. 11, Nov 1979, pp.1575-1577.