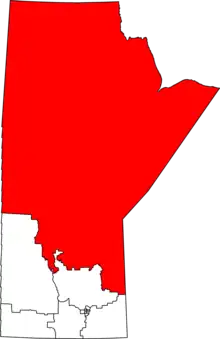
 Churchill—Keewatinook Aski in relation to other Manitoba federal electoral districts as of the 2013 Representation Order. | |||
| Federal electoral district | |||
| Legislature | House of Commons | ||
| MP |
New Democratic | ||
| District created | 1933 | ||
| First contested | 1935 | ||
| Last contested | 2021 | ||
| District webpage | profile, map | ||
| Demographics | |||
| Population (2011)[1] | 85,148 | ||
| Electors (2015) | 47,940 | ||
| Area (km²)[1] | 494,701 | ||
| Pop. density (per km²) | 0.17 | ||
| Census division(s) | Division No. 19, Division No. 21, Division No. 22, Division No. 23 | ||
| Census subdivision(s) | Thompson, Flin Flon, The Pas, Churchill, Norway House 17, St. Theresa Point, Kelsey, Opaskwayak Cree Nation 21E, Fort Alexander 3, Nelson House 170 | ||
Churchill—Keewatinook Aski (formerly Churchill) is a federal electoral district in Manitoba, Canada, that has been represented in the House of Commons of Canada since 1935. It covers the northern four-fifths of Manitoba, a vast wilderness area dotted with small municipalities and First Nations reserves. It was named after the town of Churchill, Manitoba, which resides on Churchill River. It is the fifth-largest riding in all of Canada.
History
The riding was created in 1933 when Nelson riding was abolished. The entire area of Nelson was transferred into the new riding of Churchill.
This riding gained territory from Selkirk—Interlake and was renamed "Churchill—Keewatinook Aski" during the 2012 electoral redistribution. "Keewatinook Aski" (ᑮᐍᑎᓄᕽ ᐊᐢᑭᐩ kîwêtinohk askiy) means Northern region in Cree language.
Demographics
The riding has the highest percentage of First Nations people (61.1%) in Canada,[2] as well as the highest percentage of Cree speakers - both those whose mother tongue (21.6%) is Cree[3] and those that use it as a home language (16.6%).[4]
| Panethnic group | 2021[5] | 2016[6] | 2011[7] | |||||||||||
|---|---|---|---|---|---|---|---|---|---|---|---|---|---|---|
| Pop. | % | Pop. | % | Pop. | % | |||||||||
| Indigenous | 61,455 | 76.49% | 65,415 | 76.33% | 61,930 | 73.99% | ||||||||
| European[lower-alpha 1] | 15,845 | 19.72% | 17,915 | 20.91% | 20,470 | 24.46% | ||||||||
| South Asian | 1,655 | 2.06% | 1,185 | 1.38% | 520 | 0.62% | ||||||||
| African | 455 | 0.57% | 455 | 0.53% | 240 | 0.29% | ||||||||
| Southeast Asian[lower-alpha 2] | 420 | 0.52% | 310 | 0.36% | 285 | 0.34% | ||||||||
| East Asian[lower-alpha 3] | 210 | 0.26% | 255 | 0.3% | 95 | 0.11% | ||||||||
| Middle Eastern[lower-alpha 4] | 120 | 0.15% | 45 | 0.05% | 70 | 0.08% | ||||||||
| Latin American | 95 | 0.12% | 70 | 0.08% | 55 | 0.07% | ||||||||
| Other/multiracial[lower-alpha 5] | 90 | 0.11% | 55 | 0.06% | 40 | 0.05% | ||||||||
| Total responses | 80,340 | 98.87% | 85,695 | 98.6% | 83,700 | 98.3% | ||||||||
| Total population | 81,258 | 100% | 86,908 | 100% | 85,148 | 100% | ||||||||
| Notes: Totals greater than 100% due to multiple origin responses. Demographics based on 2012 Canadian federal electoral redistribution riding boundaries. | ||||||||||||||
Members of Parliament
This riding has elected the following Members of Parliament:
| Parliament | Years | Member | Party | |
|---|---|---|---|---|
| Churchill Riding created from Nelson |
||||
| 18th | 1935–1940 | Thomas Crerar | Liberal | |
| 19th | 1940–1945 | |||
| 20th | 1945–1949 | Ronald Moore | Co-operative Commonwealth | |
| 21st | 1949–1953 | George Weaver | Liberal | |
| 22nd | 1953–1957 | |||
| 23rd | 1957–1958 | Robert Simpson | Progressive Conservative | |
| 24th | 1958–1962 | |||
| 25th | 1962–1963 | |||
| 26th | 1963–1965 | |||
| 27th | 1965–1968 | |||
| 28th | 1968–1972 | |||
| 29th | 1972–1974 | Charles Keith Taylor | ||
| 30th | 1974–1979 | Cecil Smith | ||
| 31st | 1979–1980 | Rod Murphy | New Democratic | |
| 32nd | 1980–1984 | |||
| 33rd | 1984–1988 | |||
| 34th | 1988–1993 | |||
| 35th | 1993–1997 | Elijah Harper | Liberal | |
| 36th | 1997–2000 | Bev Desjarlais | New Democratic | |
| 37th | 2000–2004 | |||
| 38th | 2004–2005 | |||
| 2005–2006 | Independent | |||
| 39th | 2006–2008 | Tina Keeper | Liberal | |
| 40th | 2008–2011 | Niki Ashton | New Democratic | |
| 41st | 2011–2015 | |||
| Churchill—Keewatinook Aski | ||||
| 42nd | 2015–2019 | Niki Ashton | New Democratic | |
| 43rd | 2019–2021 | |||
| 44th | 2021–present | |||
Current Member of Parliament
Its Member of Parliament (MP) is Niki Ashton. She is a member of the New Democratic Party.
Election results
Churchill—Keewatinook Aski, 2015–present
| 2021 Canadian federal election | ||||||||
|---|---|---|---|---|---|---|---|---|
| Party | Candidate | Votes | % | ±% | Expenditures | |||
| New Democratic | Niki Ashton | 7,632 | 42.6 | -7.7 | $55,604.26 | |||
| Liberal | Shirley Robinson | 4,514 | 25.2 | +5.3 | $52,797.79 | |||
| Conservative | Charlotte Larocque | 4,330 | 24.2 | +0.5 | none listed | |||
| People's | Dylan Young | 899 | 5.0 | +3.8 | $0.00 | |||
| Green | Ralph McLean | 552 | 3.1 | -1.7 | $0.00 | |||
| Total valid votes/expense limit | 17,927 | 98.8 | – | $122,781.65 | ||||
| Total rejected ballots | 210 | 1.2 | ||||||
| Turnout | 18,137 | 36.6 | ||||||
| Eligible voters | 49,579 | |||||||
| New Democratic hold | Swing | -6.5 | ||||||
| Source: Elections Canada[8] | ||||||||
| 2019 Canadian federal election | ||||||||
|---|---|---|---|---|---|---|---|---|
| Party | Candidate | Votes | % | ±% | Expenditures | |||
| New Democratic | Niki Ashton | 11,919 | 50.3 | +5.26 | $62,221.20 | |||
| Conservative | Cyara Bird | 5,616 | 23.7 | +13.38 | none listed | |||
| Liberal | Judy Klassen | 4,714 | 19.9 | -22.1 | $59,410.31 | |||
| Green | Ralph McLean | 1,144 | 4.8 | +3.01 | none listed | |||
| People's | Ken Klyne | 294 | 1.2 | $0.00 | ||||
| Total valid votes/expense limit | 23,687 | 100.0 | ||||||
| Total rejected ballots | 190 | |||||||
| Turnout | 23,877 | 48.8 | ||||||
| Eligible voters | 48,949 | |||||||
| New Democratic hold | Swing | -4.06 | ||||||
| Source: Elections Canada[9][10] | ||||||||
| 2015 Canadian federal election | ||||||||
|---|---|---|---|---|---|---|---|---|
| Party | Candidate | Votes | % | ±% | Expenditures | |||
| New Democratic | Niki Ashton | 13,487 | 45.04 | -6.65 | $107,253.16 | |||
| Liberal | Rebecca Chartrand | 12,575 | 42.00 | +22.13 | $108,676.93 | |||
| Conservative | Kyle G. Mirecki | 3,090 | 10.32 | -15.81 | – | |||
| Green | August Hastmann | 537 | 1.79 | -0.52 | – | |||
| Libertarian | Zachary Linnick | 255 | 0.85 | – | – | |||
| Total valid votes/expense limit | 29,944 | 100.00 | $233,135.69 | |||||
| Total rejected ballots | 252 | 0.83 | – | |||||
| Turnout | 30,196 | 61.58 | – | |||||
| Eligible voters | 49,036 | |||||||
| New Democratic hold | Swing | -14.39 | ||||||
| Source: Elections Canada[11][12] | ||||||||
| 2011 federal election redistributed results[13] | |||
|---|---|---|---|
| Party | Vote | % | |
| New Democratic | 10,962 | 51.70 | |
| Conservative | 5,540 | 26.13 | |
| Liberal | 4,212 | 19.86 | |
| Green | 491 | 2.32 | |
Churchill, 1935–2015
| 2011 Canadian federal election | ||||||||
|---|---|---|---|---|---|---|---|---|
| Party | Candidate | Votes | % | ±% | Expenditures | |||
| New Democratic | Niki Ashton | 10,262 | 51.12 | +3.36 | – | |||
| Conservative | Wally Daudrich | 5,256 | 26.18 | +5.68 | – | |||
| Liberal | Sydney Garrioch | 4,087 | 20.36 | -8.38 | – | |||
| Green | Alberteen Spence | 471 | 2.35 | -0.94 | – | |||
| Total valid votes/expense limit | 20,076 | 100.00 | ||||||
| Total rejected ballots | 107 | 0.53 | -0.02 | |||||
| Turnout | 20,183 | 45.35 | +5.20 | |||||
| Eligible voters | 44,509 | – | – | |||||
| 2008 Canadian federal election | ||||||||
|---|---|---|---|---|---|---|---|---|
| Party | Candidate | Votes | % | ±% | Expenditures | |||
| New Democratic | Niki Ashton | 8,734 | 47.76 | +19.35 | $79,086 | |||
| Liberal | Tina Keeper | 5,289 | 28.74 | -11.94 | – | |||
| Conservative | Wally Daudrich | 3,773 | 20.50 | +8.95 | $45,616 | |||
| Green | Saara Harvie | 606 | 3.29 | +1.69 | $28 | |||
| Total valid votes/expense limit | 18,402 | 100.00 | $91,452 | |||||
| Total rejected ballots | 102 | 0.55 | +0.19 | |||||
| Turnout | 18,504 | 40.15 | -13.48 | |||||
| New Democrat gain from Liberal | Swing | + | ||||||
| 2006 Canadian federal election: Churchill | ||||||||
|---|---|---|---|---|---|---|---|---|
| Party | Candidate | Votes | % | Expenditures | ||||
| Liberal | Tina Keeper | 10,157 | 40.68 | $75,179.50 | ||||
| New Democratic | Niki Christina Ashton | 7,093 | 28.41 | $70,290.02 | ||||
| Independent | Bev Desjarlais | 4,283 | 17.16 | $23,042.68 | ||||
| Conservative | Nazir Ahmad | 2,886 | 11.56 | $23,875.20 | ||||
| Green | Jeff Fountain | 401 | 1.61 | $2,837.23 | ||||
| Independent | Brad Bodnar | 146 | 0.58 | $68.69 | ||||
| Total valid votes | 24,966 | 100.00 | ||||||
| Total rejected ballots | 90 | |||||||
| Turnout | 25,056 | 55.70 | ||||||
| Electors on lists | 44,982 | |||||||
| Sources: Official Results, Elections Canada and Financial Returns, Elections Canada. | ||||||||
| 2004 Canadian federal election: Churchill | ||||||||
|---|---|---|---|---|---|---|---|---|
| Party | Candidate | Votes | % | Expenditures | ||||
| New Democratic | Bev Desjarlais | 8,612 | 43.44 | $45,503.18 | ||||
| Liberal | Ron Evans | 7,604 | 38.35 | $61,955.23 | ||||
| Conservative | Bill Archer | 2,999 | 15.13 | $10,398.38 | ||||
| Green | C. David Nickarz | 612 | 3.09 | $646.91 | ||||
| Total valid votes | 19,827 | 100.00 | ||||||
| Total rejected ballots | 88 | |||||||
| Turnout | 19,915 | 41.40 | ||||||
| Electors on lists | 48,106 | |||||||
| Percentage change figures are factored for redistribution. Conservative Party percentages are contrasted with the combined Canadian Alliance and Progressive Conservative percentages from 2000. | ||||||||
| Sources: Official Results, Elections Canada and Financial Returns, Elections Canada. | ||||||||
| 2000 Canadian federal election: Churchill | ||||||||
|---|---|---|---|---|---|---|---|---|
| Party | Candidate | Votes | % | Expenditures | ||||
| New Democratic | Bev Desjarlais | 10,477 | 44.94 | $41,854.47 | ||||
| Liberal | Elijah Harper | 7,514 | 32.23 | $55,871.45 | ||||
| Alliance | Jason Shaw | 4,126 | 17.70 | $7,444.04 | ||||
| Progressive Conservative | Doreen Murray | 1,198 | 5.14 | $2,722.40 | ||||
| Total valid votes | 23,315 | 100.00 | ||||||
| Total rejected ballots | 98 | |||||||
| Turnout | 23,413 | 51.05 | ||||||
| Electors on lists | 45,860 | |||||||
| Sources: Official Results, Elections Canada and Financial Returns, Elections Canada. | ||||||||
| 1997 Canadian federal election: Churchill | ||||||||
|---|---|---|---|---|---|---|---|---|
| Party | Candidate | Votes | % | Expenditures | ||||
| New Democratic | Bev Desjarlais | 9,616 | 41.17 | $45,525 | ||||
| Liberal | Elijah Harper | 6,852 | 29.33 | $59,373 | ||||
| Reform | Corky Peterson | 4,438 | 19.00 | $11,803 | ||||
| Progressive Conservative | Don Knight | 2,452 | 10.50 | $10,729 | ||||
| Total valid votes | 23,358 | 100.00 | ||||||
| Total rejected ballots | 158 | |||||||
| Turnout | 23,516 | 50.25 | ||||||
| Electors on lists | 46,801 | |||||||
| Sources: Official Results, Elections Canada and Financial Returns, Elections Canada. | ||||||||
| 1993 Canadian federal election | ||||||||
|---|---|---|---|---|---|---|---|---|
| Party | Candidate | Votes | % | ±% | ||||
| Liberal | Elijah Harper | 9,658 | 40.7 | +17.7 | ||||
| New Democratic | Rod Murphy | 8,751 | 36.9 | -19.5 | ||||
| Progressive Conservative | Don Knight | 2,438 | 10.3 | -10.3 | ||||
| Reform | Wally Daudrich | 2,275 | 9.6 | |||||
| National | Charles Settee | 590 | 2.5 | – | ||||
| Total valid votes | 23,712 | 100.0 | ||||||
| 1988 Canadian federal election | ||||||||
|---|---|---|---|---|---|---|---|---|
| Party | Candidate | Votes | % | ±% | ||||
| New Democratic | Rod Murphy | 14,168 | 56.4 | +10.8 | ||||
| Liberal | Rodney Spence | 5,800 | 23.1 | +5.1 | ||||
| Progressive Conservative | Nazir Ahmad | 5,164 | 20.5 | -13.2 | ||||
| Total valid votes | 25,132 | 100.0 | ||||||
| 1984 Canadian federal election | ||||||||
|---|---|---|---|---|---|---|---|---|
| Party | Candidate | Votes | % | ±% | ||||
| New Democratic | Rod Murphy | 10,829 | 45.6 | +2.3 | ||||
| Progressive Conservative | Harvey Hanson | 8,010 | 33.7 | +8.2 | ||||
| Liberal | Jack Kennedy | 4,272 | 18.0 | -11.8 | ||||
| Independent | Andrew Kirkness | 377 | 1.6 | – | ||||
| Libertarian | Ketih B.P. Muirhead | 281 | 1.2 | |||||
| Total valid votes | 23,769 | 100.0 | ||||||
| 1980 Canadian federal election | ||||||||
|---|---|---|---|---|---|---|---|---|
| Party | Candidate | Votes | % | ±% | ||||
| New Democratic | Rod Murphy | 10,319 | 43.3 | -8.4 | ||||
| Liberal | Alan Ross | 7,092 | 29.7 | +13.5 | ||||
| Progressive Conservative | Cec Smith | 6,084 | 25.5 | -6.6 | ||||
| Rhinoceros | Roland Campbell | 352 | 1.5 | |||||
| Total valid votes | 23,847 | 100.0 | ||||||
| 1979 Canadian federal election | ||||||||
|---|---|---|---|---|---|---|---|---|
| Party | Candidate | Votes | % | ±% | ||||
| New Democratic | Rod Murphy | 12,544 | 51.7 | +21.0 | ||||
| Progressive Conservative | Cecil Smith | 7,802 | 32.1 | -8.8 | ||||
| Liberal | Andrew Kirkness | 3,936 | 16.2 | -10.1 | ||||
| Total valid votes | 24,282 | 100.0 | ||||||
| 1974 Canadian federal election | ||||||||
|---|---|---|---|---|---|---|---|---|
| Party | Candidate | Votes | % | ±% | ||||
| Progressive Conservative | Cecil Smith | 11,225 | 40.9 | +6.4 | ||||
| New Democratic | Dan Reagan | 8,415 | 30.7 | -2.4 | ||||
| Liberal | Jean René Allard | 7,212 | 26.3 | -4.9 | ||||
| Social Credit | Ed Heinrichs | 577 | 2.1 | |||||
| Total valid votes | 27,429 | 100.0 | ||||||
| 1972 Canadian federal election: Churchill | ||||||||
|---|---|---|---|---|---|---|---|---|
| Party | Candidate | Votes | % | ±% | ||||
| Progressive Conservative | Keith Taylor | 9,462 | 34.6 | -7.2 | ||||
| New Democratic | Don Duff | 9,059 | 33.1 | +10.4 | ||||
| Liberal | Bruce Dunlop | 8,536 | 31.2 | -4.4 | ||||
| Independent | R. Jim Henry | 327 | 1.2 | |||||
| Total valid votes | 27,384 | 100.0 | ||||||
| 1968 Canadian federal election | ||||||||
|---|---|---|---|---|---|---|---|---|
| Party | Candidate | Votes | % | ±% | ||||
| Progressive Conservative | Robert Simpson | 9,009 | 41.8 | -9.2 | ||||
| Liberal | Frank Dembinsky | 7,673 | 35.6 | +8.6 | ||||
| New Democratic | Brian Koshul | 4,888 | 22.7 | +7.0 | ||||
| Total valid votes | 21,570 | 100.0 | ||||||
| 1965 Canadian federal election | ||||||||
|---|---|---|---|---|---|---|---|---|
| Party | Candidate | Votes | % | ±% | ||||
| Progressive Conservative | Robert Simpson | 10,773 | 51.0 | -2.3 | ||||
| Liberal | F.L. Jobin | 5,694 | 27.0 | -6.1 | ||||
| New Democratic | Ken MacMaster | 3,306 | 15.6 | +2.0 | ||||
| Social Credit | Curt R. Shielman | 1,352 | 6.4 | |||||
| Total valid votes | 21,125 | 100.0 | ||||||
| 1963 Canadian federal election | ||||||||
|---|---|---|---|---|---|---|---|---|
| Party | Candidate | Votes | % | ±% | ||||
| Progressive Conservative | Robert Simpson | 11,707 | 53.3 | +2.0 | ||||
| Liberal | Bruce Dunlop | 7,253 | 33.0 | +2.5 | ||||
| New Democratic | Florence Matthews | 2,990 | 13.6 | -4.5 | ||||
| Total valid votes | 21,950 | 100.0 | ||||||
| 1962 Canadian federal election | ||||||||
|---|---|---|---|---|---|---|---|---|
| Party | Candidate | Votes | % | ±% | ||||
| Progressive Conservative | Robert Simpson | 10,943 | 51.3 | -13.4 | ||||
| Liberal | Francis Laurence Jobin | 6,511 | 30.6 | +7.2 | ||||
| New Democratic | Florence Matthews | 3,858 | 18.1 | +6.2 | ||||
| Total valid votes | 21,312 | 100.0 | ||||||
Note: NDP vote is compared to CCF vote in 1958 election.
| 1958 Canadian federal election | ||||||||
|---|---|---|---|---|---|---|---|---|
| Party | Candidate | Votes | % | ±% | ||||
| Progressive Conservative | Robert Simpson | 11,506 | 64.7 | +25.9 | ||||
| Liberal | Lorne Paterson Ferg | 4,159 | 23.4 | -7.9 | ||||
| Co-operative Commonwealth | Jack Freedman | 2,118 | 11.9 | +0.2 | ||||
| Total valid votes | 17,783 | 100.0 | ||||||
| 1957 Canadian federal election | ||||||||
|---|---|---|---|---|---|---|---|---|
| Party | Candidate | Votes | % | ±% | ||||
| Progressive Conservative | Robert Simpson | 6,191 | 38.8 | +20.8 | ||||
| Liberal | George Dyer Weaver | 4,993 | 31.3 | -9.1 | ||||
| Social Credit | Bruce Moore | 2,891 | 18.1 | -2.1 | ||||
| Co-operative Commonwealth | Gerald Robert Clarkson | 1,870 | 11.7 | -6.9 | ||||
| Total valid votes | 15,945 | 100.0 | ||||||
| 1953 Canadian federal election | ||||||||
|---|---|---|---|---|---|---|---|---|
| Party | Candidate | Votes | % | ±% | ||||
| Liberal | George Dyer Weaver | 4,984 | 40.4 | -5.2 | ||||
| Progressive Conservative | William George Thompson | 2,567 | 20.8 | -3.0 | ||||
| Social Credit | Delbert Leroy Downs | 2,490 | 20.2 | |||||
| Co-operative Commonwealth | Ronald Stewart Moore | 2,293 | 18.6 | -12.0 | ||||
| Total valid votes | 12,334 | 100.0 | ||||||
| 1949 Canadian federal election | ||||||||
|---|---|---|---|---|---|---|---|---|
| Party | Candidate | Votes | % | ±% | ||||
| Liberal | George Dyer Weaver | 6,847 | 45.6 | +13.2 | ||||
| Co-operative Commonwealth | Ronald Stewart Moore | 4,595 | 30.6 | -8.2 | ||||
| Progressive Conservative | Robert Franklin Milton | 3,570 | 23.8 | -5.1 | ||||
| Total valid votes | 15,012 | 100.0 | ||||||
| 1945 Canadian federal election | ||||||||
|---|---|---|---|---|---|---|---|---|
| Party | Candidate | Votes | % | ±% | ||||
| Co-operative Commonwealth | Ronald Moore | 5,226 | 38.8 | |||||
| Liberal | George Dyer Weaver | 4,359 | 32.4 | -30.1 | ||||
| Progressive Conservative | Cecil Ruddock Neely | 3,884 | 28.8 | -8.7 | ||||
| Total valid votes | 13,469 | 100.0 | ||||||
Note: Progressive Conservative vote is compared to "National Government" vote in 1940 election.
| 1940 Canadian federal election | ||||||||
|---|---|---|---|---|---|---|---|---|
| Party | Candidate | Votes | % | ±% | ||||
| Liberal | Thomas Crerar | 8,276 | 62.5 | +22.5 | ||||
| National Government | Will Blakeman Scarth | 4,963 | 37.5 | +3.2 | ||||
| Total valid votes | 13,239 | 100.0 | ||||||
Note: "National Government" vote is compared to Conservative vote in 1935 election.
| 1935 Canadian federal election | ||||||||
|---|---|---|---|---|---|---|---|---|
| Party | Candidate | Votes | % | |||||
| Liberal | Thomas Crerar | 3,603 | 40.0 | |||||
| Conservative | Barney M. Stitt | 3,091 | 34.3 | |||||
| Co-operative Commonwealth | Alexander Stewart | 2,313 | 25.7 | |||||
| Total valid votes | 9,007 | 100.0 | ||||||
See also
References
- "Churchill—Keewatinook Aski (Code 46003) Census Profile". 2011 census. Government of Canada - Statistics Canada. Retrieved March 3, 2011.
- Riding history for Churchill (1933– ) from the Library of Parliament
- Expenditures - 2008
- Expenditures - 2004
- Expenditures - 2000
- Expenditures - 1997
Notes
- ↑ Statistic includes all persons that did not make up part of a visible minority or an indigenous identity.
- ↑ Statistic includes total responses of "Filipino" and "Southeast Asian" under visible minority section on census.
- ↑ Statistic includes total responses of "Chinese", "Korean", and "Japanese" under visible minority section on census.
- ↑ Statistic includes total responses of "West Asian" and "Arab" under visible minority section on census.
- ↑ Statistic includes total responses of "Visible minority, n.i.e." and "Multiple visible minorities" under visible minority section on census.
- 1 2 Statistics Canada: 2012
- ↑ "Aboriginal Identity (8), Sex (3) and Age Groups (12) for the Population of Canada, Provinces, Territories and Federal Electoral Districts (2003 Representation Order), 2006 Census - 20% Sample Data". 2.statcan.gc.ca. Retrieved November 19, 2012.
- ↑ "2011 Census of Canada: Topic-based tabulations | Detailed Mother Tongue (232), Knowledge of Official Languages (5), Age Groups (17A) and Sex (3) for the Population Excluding Institutional Residents of Canada, Provinces, Territories and Federal Electoral Districts (2003 Representation Order), 2011 Census". 2.statcan.gc.ca. Retrieved November 19, 2012.
- ↑ "First Official Language Spoken (7), Detailed Language Spoken Most Often at Home (232), Age Groups (17A) and Sex (3) for the Population Excluding Institutional Residents of Canada, Provinces, Territories and Federal Electoral Districts (2003 Representation Order), 2011 Census". 2.statcan.gc.ca. Retrieved November 19, 2012.
- ↑ Government of Canada, Statistics Canada (October 26, 2022). "Census Profile, 2021 Census of Population". www12.statcan.gc.ca. Retrieved October 22, 2023.
- ↑ Government of Canada, Statistics Canada (October 27, 2021). "Census Profile, 2016 Census". www12.statcan.gc.ca. Retrieved October 22, 2023.
- ↑ Government of Canada, Statistics Canada (November 27, 2015). "NHS Profile". www12.statcan.gc.ca. Retrieved October 22, 2023.
- ↑ "List of confirmed candidates – September 20, 2021 Federal Election". Elections Canada. Retrieved September 2, 2021.
- ↑ "List of confirmed candidates". Elections Canada. Retrieved October 4, 2019.
- ↑ "Election Night Results". Elections Canada. Retrieved November 9, 2019.
- ↑ Elections Canada – Confirmed candidates for Churchill—Keewatinook Aski, 30 September 2015
- ↑ Elections Canada – Preliminary Election Expenses Limits for Candidates Archived August 15, 2015, at the Wayback Machine
- ↑ Pundits' Guide to Canadian Elections