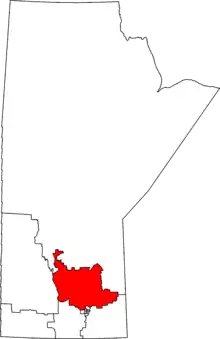
 Selkirk—Interlake—Eastman in relation to other Manitoba federal electoral districts as of the 2013 Representation Order. | |||
| Federal electoral district | |||
| Legislature | House of Commons | ||
| MP |
Conservative | ||
| District created | 1996 | ||
| First contested | 1997 | ||
| Last contested | 2021 | ||
| District webpage | profile, map | ||
| Demographics | |||
| Population (2011)[1] | 91,463 | ||
| Electors (2015) | 69,587 | ||
| Area (km²)[2] | 25,824 | ||
| Pop. density (per km²) | 3.5 | ||
| Census subdivision(s) | Springfield, St. Andrews, St. Clements, Selkirk, Rockwood, Portage la Prairie, Gimli, Stonewall, Brokenhead, Woodlands | ||
Selkirk—Interlake—Eastman (formerly Selkirk—Interlake) is a federal electoral district in Manitoba, Canada, that has been represented in the House of Commons of Canada from 1976 to 1987, and since 1997.
The riding was a battleground between the New Democratic Party and conservative parties that has become more and more conservative as the years passed, and is now a safe Conservative Party seat.
Geography
The riding is located generally between Lake Winnipeg and Lake Winnipegosis and includes the northern suburbs of Winnipeg and the City of Selkirk, Manitoba. In addition to Selkirk, the riding includes the communities of St. Andrews, St. Clements, Rockwood, Woodlands, Brokenhead, Stonewall, R.M. of Gimli, and the R.M. of Bifrost.
Selkirk itself tilts toward the NDP, but it is not enough to overcome the growing conservative bent of the rest of the riding.
History
The electoral district was originally created in 1976 from the former districts of Portage, Selkirk and Winnipeg South Centre.
It was abolished in 1987 and divided into Selkirk, Portage—Interlake, Provencher, and Churchill ridings.
It was re-created in 1996 from Selkirk—Red River, Portage—Interlake, Provencher and Churchill.
Selkirk—Interlake lost territory to Churchill—Keewatinook Aski, Provencher and Portage—Lisgar, gained territory from Provencher, and was renamed "Selkirk—Interlake—Eastman" during the 2012 electoral redistribution.
Demographics
| Panethnic group | 2021[3] | 2016[4] | 2011[5] | |||||||||||
|---|---|---|---|---|---|---|---|---|---|---|---|---|---|---|
| Pop. | % | Pop. | % | Pop. | % | |||||||||
| European[lower-alpha 1] | 72,125 | 74.37% | 70,590 | 77.56% | 71,815 | 81.28% | ||||||||
| Indigenous | 21,915 | 22.6% | 18,680 | 20.53% | 15,310 | 17.33% | ||||||||
| Southeast Asian[lower-alpha 2] | 900 | 0.93% | 545 | 0.6% | 255 | 0.29% | ||||||||
| South Asian | 840 | 0.87% | 315 | 0.35% | 290 | 0.33% | ||||||||
| African | 430 | 0.44% | 280 | 0.31% | 250 | 0.28% | ||||||||
| East Asian[lower-alpha 3] | 300 | 0.31% | 255 | 0.28% | 240 | 0.27% | ||||||||
| Latin American | 200 | 0.21% | 105 | 0.12% | 35 | 0.04% | ||||||||
| Middle Eastern[lower-alpha 4] | 120 | 0.12% | 85 | 0.09% | 35 | 0.04% | ||||||||
| Other/multiracial[lower-alpha 5] | 160 | 0.16% | 170 | 0.19% | 110 | 0.12% | ||||||||
| Total responses | 96,985 | 95.67% | 91,010 | 95.9% | 88,350 | 96.6% | ||||||||
| Total population | 101,373 | 100% | 94,897 | 100% | 91,463 | 100% | ||||||||
| Notes: Totals greater than 100% due to multiple origin responses. Demographics based on 2012 Canadian federal electoral redistribution riding boundaries. | ||||||||||||||
- According to the Canada 2006 Census
Languages: 84.11% English, 1.99% French, 13.70% Other
Religions (2001): 51.05% Protestant, 23.96% Catholic, 19.83% No religion, 3.13% Other Christian
Average income: $23,818
Riding associations
Riding associations are the local branches of the national political parties:
| Party | Association Name | CEO | HQ Address | HQ City | |
| Christian Heritage Party of Canada | Selkirk—Interlake Christian Heritage Party Electoral District Association | Alexander Siepman | PO BOX 17 GRP 354 RR3 | Winnipeg | |
| Conservative Party of Canada | Selkirk—Interlake Conservative Association | Frank Woods | P.O. Box 171 | Sandy Hook | |
| Liberal Party of Canada | Selkirk—Interlake Federal Liberal Association | Robert E. Chamberlain | P.O. Box 131 | Arnes | |
| New Democratic Party | Selkirk—Interlake Federal NDP Riding Association | Sean Palsson | P.O. Box 1359 | Arborg | |
Members of Parliament
This riding has elected the following Members of Parliament:
| Parliament | Years | Member | Party | |
|---|---|---|---|---|
| Selkirk—Interlake Riding created from Portage, Selkirk and Winnipeg South Centre |
||||
| 31st | 1979–1980 | Terry Sargeant | New Democratic | |
| 32nd | 1980–1984 | |||
| 33rd | 1984–1988 | Felix Holtmann | Progressive Conservative | |
| Riding dissolved into Selkirk, Portage—Interlake, Provencher and Churchill |
||||
| Riding re-created from Selkirk—Red River, Portage—Interlake, Provencher and Churchill |
||||
| 36th | 1997–2000 | Howard Hilstrom | Reform | |
| 2000–2000 | Alliance | |||
| 37th | 2000–2003 | |||
| 2003–2004 | Conservative | |||
| 38th | 2004–2006 | James Bezan | ||
| 39th | 2006–2008 | |||
| 40th | 2008–2011 | |||
| 41st | 2011–2015 | |||
| Selkirk—Interlake—Eastman | ||||
| 42nd | 2015–2019 | James Bezan | Conservative | |
| 43rd | 2019–2021 | |||
| 44th | 2021–present | |||
Current Member of Parliament
Its Member of Parliament is James Bezan, a former rancher who was first elected in 2004. He is a member of the Conservative Party of Canada and has served as a member on the 'Standing Committee on Agriculture and Agri-Food'.
Election results
Selkirk—Interlake—Eastman, 2015–present
| 2021 Canadian federal election | ||||||||
|---|---|---|---|---|---|---|---|---|
| Party | Candidate | Votes | % | ±% | Expenditures | |||
| Conservative | James Bezan | 28,308 | 57.1 | -5.6 | $59,811.25 | |||
| New Democratic | Margaret Smith | 9,604 | 19.4 | +1.5 | $6,587.46 | |||
| Liberal | Detlev Regelsky | 6,567 | 13.2 | +1.1 | $9,990.47 | |||
| People's | Ian Kathwaroon | 3,800 | 7.7 | +6.3 | $2,309.10 | |||
| Green | Wayne James | 1,328 | 2.7 | -3.2 | $3,024.88 | |||
| Total valid votes/expense limit | 49,607 | 99.3 | – | $120,770.45 | ||||
| Total rejected ballots | 363 | 0.7 | ||||||
| Turnout | 49,970 | 66.2 | ||||||
| Eligible voters | 75,440 | |||||||
| Conservative hold | Swing | -3.6 | ||||||
| Source: Elections Canada[6] | ||||||||
| 2019 Canadian federal election | ||||||||
|---|---|---|---|---|---|---|---|---|
| Party | Candidate | Votes | % | ±% | Expenditures | |||
| Conservative | James Bezan | 31,109 | 62.7 | +10.80 | $53,785.73 | |||
| New Democratic | Robert A. Smith | 8,873 | 17.9 | +6.46 | none listed | |||
| Liberal | Detlev Regelsky | 6,003 | 12.1 | -19.32 | none listed | |||
| Green | Wayne James | 2,934 | 5.9 | +5.90 | none listed | |||
| People's | Ian Kathwaroon | 683 | 1.4 | $0.00 | ||||
| Total valid votes/expense limit | 49,602 | 100 | ||||||
| Total rejected ballots | 322 | |||||||
| Turnout | 49,924 | 68.7 | ||||||
| Eligible voters | 72,707 | |||||||
| Conservative hold | Swing | -5.68 | ||||||
| Source: Elections Canada[7][8] | ||||||||
| 2015 Canadian federal election | ||||||||
|---|---|---|---|---|---|---|---|---|
| Party | Candidate | Votes | % | ±% | Expenditures | |||
| Conservative | James Bezan | 25,617 | 51.90 | -14.60 | $96,714.11 | |||
| Liberal | Joanne Levy | 15,508 | 31.42 | +26.56 | $16,715.09 | |||
| New Democratic | Deborah Chief | 5,649 | 11.44 | -13.61 | $29,151.47 | |||
| Green | Wayne James | 1,707 | 3.46 | -0.01 | 4,402.63 | |||
| Libertarian | Donald L. Grant | 882 | 1.79 | – | ||||
| Total valid votes/Expense limit | 49,363 | 100.00 | $228,041.57 | |||||
| Total rejected ballots | 216 | 0.44 | – | |||||
| Turnout | 49,579 | 69.51 | – | |||||
| Eligible voters | 71,331 | |||||||
| Conservative hold | Swing | -20.58 | ||||||
| Source: Elections Canada[9][10] | ||||||||
| 2011 federal election redistributed results[11] | |||
|---|---|---|---|
| Party | Vote | % | |
| Conservative | 28,380 | 66.49 | |
| New Democratic | 10,695 | 25.06 | |
| Liberal | 2,072 | 4.85 | |
| Green | 1,482 | 3.47 | |
| Others | 54 | 0.13 | |
Selkirk—Interlake, 1997–2015
| 2011 Canadian federal election | ||||||||
|---|---|---|---|---|---|---|---|---|
| Party | Candidate | Votes | % | ±% | Expenditures | |||
| Conservative | James Bezan[12] | 26,848 | 65.2 | +4.6 | – | |||
| New Democratic | Sean Palsson | 10,933 | 26.5 | +1.8 | – | |||
| Liberal | Duncan Geisler | 1,980 | 4.8 | -3.5 | – | |||
| Green | Don Winstone | 1,423 | 3.5 | -2.0 | – | |||
| Total valid votes/Expense limit | 41,184 | 100.0 | – | |||||
| Total rejected ballots | 160 | 0.4 | -0.1 | |||||
| Turnout | 41,344 | 63.9 | +6 | |||||
| Eligible voters | 64,727 | – | – | |||||
| 2008 Canadian federal election | ||||||||
|---|---|---|---|---|---|---|---|---|
| Party | Candidate | Votes | % | ±% | Expenditures | |||
| Conservative | James Bezan | 23,312 | 60.6 | +11.7 | $75,718 [13] | |||
| New Democratic | Pat Cordner | 9,506 | 24.7 | -12.3 | $19,306 | |||
| Liberal | Kevin Walsh | 3,203 | 8.3 | -1.7 | $8,815 | |||
| Green | Glenda Whiteman | 2,126 | 5.5 | +2.6 | $32 | |||
| Christian Heritage | Jane MacDiarmid | 295 | 0.8 | +0.3 | $424 | |||
| Total valid votes/Expense limit | 38,442 | 100.0 | $99,730 | |||||
| Total rejected ballots | 177 | 0.5 | +0.2 | |||||
| Turnout | 38,609 | 58 | -9 | |||||
| 2006 Canadian federal election | ||||||||
|---|---|---|---|---|---|---|---|---|
| Party | Candidate | Votes | % | ±% | Expenditures | |||
| Conservative | James Bezan | 21,661 | 49.0 | +1.8 | $86,024 | |||
| New Democratic | Edward Schreyer | 16,358 | 37.0 | +10.5 | $56,920 | |||
| Liberal | Bruce Benson | 4,436 | 10.0 | -12.9 | N/A | |||
| Green | Thomas Goodman | 1,283 | 2.9 | +0.5 | $1,640 | |||
| Independent | Duncan E. Geisler | 277 | 0.6 | – | $3,516 | |||
| Christian Heritage | Anthony Barendregt | 204 | 0.5 | -0.4 | $5,043 | |||
| Total valid votes | 44,219 | 100.0 | – | |||||
| Total rejected ballots | 154 | 0.3 | -0.1 | |||||
| Turnout | 44,373 | 66.6 | +7.2 | |||||
| Conservative hold | Swing | -4 | ||||||
| 2004 Canadian federal election | ||||||||
|---|---|---|---|---|---|---|---|---|
| Party | Candidate | Votes | % | ±% | Expenditures | |||
| Conservative | James Bezan | 18,727 | 47.2 | +2.5 | $74,351 | |||
| New Democratic | Duane Nicol | 10,516 | 26.5 | +6.6 | $41,939 | |||
| Liberal | Bruce Benson | 9,059 | 22.9 | -0.7 | $55,220 | |||
| Green | Trevor Farley | 982 | 2.5 | – | $716 | |||
| Christian Heritage | Anthony Barendregt | 353 | 0.9 | +0.5 | $10,799 | |||
| Total valid votes | 39,637 | 100.0 | – | |||||
| Total rejected ballots | 193 | 0.5 | +0.2 | |||||
| Turnout | 39,830 | 59.4 | -7.2 | |||||
Note: Conservative vote is compared to the total of the Canadian Alliance vote and Progressive Conservative vote in 2000 election.
| 2000 Canadian federal election | ||||||||
|---|---|---|---|---|---|---|---|---|
| Party | Candidate | Votes | % | ±% | Expenditures | |||
| Alliance | Howard Hilstrom | 17,856 | 43.8 | +15.5 | $42,070 | |||
| Liberal | Kathy Arnason | 9,612 | 23.6 | -4.5 | $61,425 | |||
| New Democratic | Paul Pododworny | 8,113 | 19.9 | -7.9 | $31,303 | |||
| Progressive Conservative | Tom Goodman | 4,992 | 12.3 | -2.6 | $10,949 | |||
| Independent | Anthony Barendregt | 178 | 0.4 | – | $2,399 | |||
| Total valid votes | 40,751 | 100.0 | – | |||||
| Total rejected ballots | 104 | 0.3 | – | |||||
| Turnout | 40,855 | 66.7 | +1.2 | |||||
Note: Canadian Alliance vote is compared to the Reform vote in 1997 election.
| 1997 Canadian federal election | ||||||||
|---|---|---|---|---|---|---|---|---|
| Party | Candidate | Votes | % | ±% | Expenditures | |||
| Reform | Howard Hilstrom | 10,937 | 28.3 | – | $23,194 | |||
| Liberal | Jon Gerrard | 10,871 | 28.1 | – | $59,732 | |||
| New Democratic | Kathleen McCallum | 10,749 | 27.8 | – | $46,587 | |||
| Progressive Conservative | Reid Kelner | 5,730 | 14.8 | – | $32,267 | |||
| Christian Heritage | Paul Kalyniuk | 363 | 0.9 | – | $1,578 | |||
| Total valid votes | 38,650 | 100.0 | – | |||||
| Total rejected ballots | 258 | 0.7 | ||||||
| Turnout | 38,908 | 65.5 | ||||||
Selkirk—Interlake, 1979–1988
| 1984 Canadian federal election: Selkirk—Interlake | ||||||||
|---|---|---|---|---|---|---|---|---|
| Party | Candidate | Votes | % | ±% | ||||
| Progressive Conservative | Felix Holtmann | 13,750 | 40.7 | +4.7 | ||||
| New Democratic | Terry Sargeant | 13,088 | 38.7 | -7.0 | ||||
| Liberal | Ed Anderson | 3,510 | 10.4 | -7.7 | ||||
| Confederation of Regions | Doug Stefanson | 3,301 | 9.8 | |||||
| Libertarian | Bob Quenett | 163 | 0.5 | |||||
| Total valid votes | 33,812 | |||||||
| History of Federal Ridings since 1867: SELKIRK--INTERLAKE, Manitoba (1976 - 1987), Library of Parliament, Parliament of Canada. Retrieved 26 January 2010. | ||||||||
| 1980 Canadian federal election | ||||||||
|---|---|---|---|---|---|---|---|---|
| Party | Candidate | Votes | % | ±% | ||||
| New Democratic | Terry Sargeant | 15,055 | 45.7 | +3.0 | ||||
| Progressive Conservative | Jon Johnson | 11,847 | 36.0 | -4.8 | ||||
| Liberal | Bill Shead | 5,953 | 18.1 | +1.5 | ||||
| Total valid votes | 32,952 | 100.0 | ||||||
| 1979 Canadian federal election | ||||||||
|---|---|---|---|---|---|---|---|---|
| Party | Candidate | Votes | % | |||||
| New Democratic | Terry Sargeant | 14,225 | 42.7 | |||||
| Progressive Conservative | Peter P. Masniuk | 13,569 | 40.7 | |||||
| Liberal | Bill Shead | 5,522 | 16.6 | |||||
| Total valid votes | 33,316 | 100.0 | ||||||
See also
References
- "Selkirk—Interlake—Eastman (Code 46010) Census Profile". 2011 census. Government of Canada - Statistics Canada. Retrieved March 3, 2011.
Notes
- ↑ Statistic includes all persons that did not make up part of a visible minority or an indigenous identity.
- ↑ Statistic includes total responses of "Filipino" and "Southeast Asian" under visible minority section on census.
- ↑ Statistic includes total responses of "Chinese", "Korean", and "Japanese" under visible minority section on census.
- ↑ Statistic includes total responses of "West Asian" and "Arab" under visible minority section on census.
- ↑ Statistic includes total responses of "Visible minority, n.i.e." and "Multiple visible minorities" under visible minority section on census.
- ↑ Statistics Canada: 2012
- ↑ Statistics Canada: 2012
- ↑ Government of Canada, Statistics Canada (October 26, 2022). "Census Profile, 2021 Census of Population". www12.statcan.gc.ca. Retrieved October 22, 2023.
- ↑ Government of Canada, Statistics Canada (October 27, 2021). "Census Profile, 2016 Census". www12.statcan.gc.ca. Retrieved October 22, 2023.
- ↑ Government of Canada, Statistics Canada (November 27, 2015). "NHS Profile". www12.statcan.gc.ca. Retrieved October 22, 2023.
- ↑ "List of confirmed candidates – September 20, 2021 Federal Election". Elections Canada. Retrieved September 2, 2021.
- ↑ "List of confirmed candidates". Elections Canada. Retrieved October 4, 2019.
- ↑ "Election Night Results". Elections Canada. Retrieved November 9, 2019.
- ↑ Elections Canada – Confirmed candidates for Selkirk—Interlake—Eastman, 30 September 2015
- ↑ Elections Canada – Preliminary Election Expenses Limits for Candidates
- ↑ Pundits' Guide to Canadian Elections
- ↑ Elections Canada accessed 21 April 2011
- ↑ Selkirk Interlake — Canada Votes 2008 - CBC.ca News