| |||||||||||||||||
All 84 seats to Cumbria County Council 43 seats needed for a majority | |||||||||||||||||
|---|---|---|---|---|---|---|---|---|---|---|---|---|---|---|---|---|---|
| |||||||||||||||||
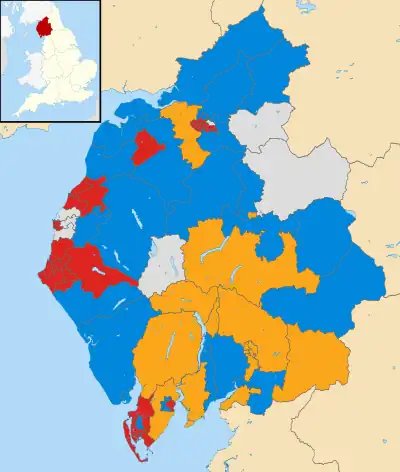
 Map showing the results of the 2013 Cumbria County Council elections. | |||||||||||||||||
| |||||||||||||||||
An election to Cumbria County Council took place on 2 May 2013 as part of the 2013 United Kingdom local elections.[1] All 84 councillors were elected from electoral divisions which returned one county councillor each by first-past-the-post voting for a four-year term of office. Following an electoral review carried out by the Local Government Boundary Commission for England, newly drawn electoral divisions were used[2] without change in the number of county councillors.[3]
All locally registered electors (British, Irish, Commonwealth and European Union citizens) who were aged 18 or over on Thursday 2 May 2013 were entitled to vote in the local elections. Those who were temporarily away from their ordinary address (for example, away working, on holiday, in student accommodation or in hospital) were also entitled to vote in the local elections,[4] although those who had moved abroad and registered as overseas electors cannot vote in the local elections. It is possible to register to vote at more than one address (such as a university student who had a term-time address and lives at home during holidays) at the discretion of the local Electoral Register Office, but it remains an offence to vote more than once in the same local government election.[5] Prior to the election the Conservatives were in a joint administration with Labour, the Liberal Democrats being in opposition.
Summary
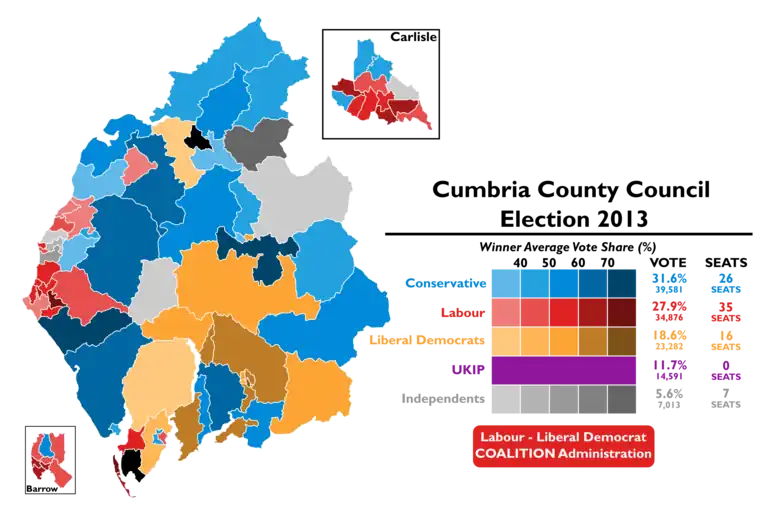
The election saw the council remain in no overall control. However Labour councillors overtook Conservatives to become the largest party on the county council.
The Liberal Democrat and Conservative parties had enough seats to form a coalition, with the support of some of the Independents, but following the election of a new Leader of the Liberal Democrat Group, a coalition was formed between them and Labour, with the Conservatives going into opposition .[6]
Results

| |||||||||
|---|---|---|---|---|---|---|---|---|---|
| Party | Councillors | Votes | |||||||
| Of total | Net | Of total | Net | ||||||
| Conservative Party | 26 | 44.0% | -12 | 26 / 84 |
39,581 | 31.6% | -8.5% | ||
| Labour Party | 35 | 41.7% | +11 | 35 / 84 |
34,876 | 27.9% | +6.5% | ||
| Liberal Democrats | 16 | 19.0% | 0 | 16 / 84 |
23,282 | 18.6% | -0.4% | ||
| UK Independence Party | 0 | 0.0% | 0 | 0 / 84 |
14,591 | 11.7% | +10.9% | ||
| Independent | 7 | 8.3% | +2 | 7 / 84 |
7,013 | 5.6% | +0.7% | ||
| Green | 0 | 0.0% | 0 | 0 / 84 |
2,798 | 2.2% | 0% | ||
| British National Party | 0 | 0.0% | 0 | 0 / 84 |
1,737 | 1.4% | -3.8% | ||
| Socialist People's Party | 0 | 0.0% | 0 | 0 / 84 |
256 | 0.2% | -0.7% | ||
| Trade Unionist and Socialist Coalition | 0 | 0.0% | 0 | 0 / 84 |
226 | 0.2% | +0.2% | ||
Members elected
The election returned members as follows:
References
- ↑ "Election 2013 Results".
- ↑ Further Electoral Review – Cumbria Archived 4 February 2013 at the Wayback Machine Local Government Boundary Commission for England
- ↑ The Cumbria (Electoral Changes) Order 2012 Legislation.gov.uk
- ↑ "The Representation of the People (Form of Canvass) (England and Wales) Regulations 2006, Schedule Part 1". Legislation.gov.uk. 13 October 2011. Retrieved 18 April 2012.
- ↑ "I have two homes. Can I register at both addresses?". The Electoral Commission. Archived from the original on 31 December 2013. Retrieved 5 January 2011.
- ↑ "Cumbria County Council approves coalition deal". BBC News. 16 May 2013. Retrieved 17 May 2013.
- ↑ "Elections 2013 results". Cumbria County Council. 3 May 2013. Retrieved 17 May 2013.