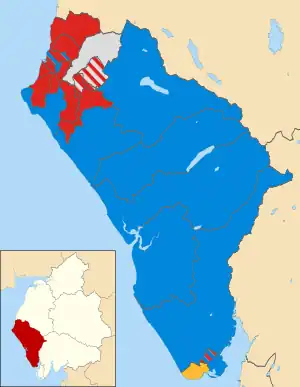
Map of the results of the 2003 Copeland council election. Labour in red, Conservatives in blue, independent in white and Liberal Democrats in yellow.
The 2003 Copeland Borough Council election took place on 1 May 2003 to elect members of Copeland Borough Council in Cumbria, England. The whole council was up for election and the Labour Party stayed in overall control of the council.[1]
Election result
| Party | Seats | Gains | Losses | Net gain/loss | Seats % | Votes % | Votes | +/− | |
|---|---|---|---|---|---|---|---|---|---|
| Labour | 31 | +1 | 60.8 | 57.7 | 30,433 | ||||
| Conservative | 16 | -1 | 31.4 | 35.0 | 18,438 | ||||
| Independent | 3 | 0 | 5.9 | 3.7 | 1,962 | ||||
| Liberal Democrats | 1 | 0 | 2.0 | 3.6 | 1,906 | ||||
3 Conservative candidates were unopposed.
Ward results
| Party | Candidate | Votes | % | ±% | |
|---|---|---|---|---|---|
| Independent | Joseph Sunderland | 463 | 71.0 | ||
| Labour | Simon Leyton | 189 | 29.0 | ||
| Majority | 274 | 42.0 | |||
| Turnout | 652 | ||||
| Party | Candidate | Votes | % | ±% | |
|---|---|---|---|---|---|
| Conservative | Yvonne Clarkson | unopposed | |||
| Conservative | John Jackson | unopposed | |||
| Party | Candidate | Votes | % | ±% | |
|---|---|---|---|---|---|
| Conservative | Keith Hitchen | 502 | 68.6 | ||
| Liberal Democrats | Roger Putnam | 230 | 31.4 | ||
| Majority | 272 | 37.2 | |||
| Turnout | 732 | ||||
| Party | Candidate | Votes | % | ±% | |
|---|---|---|---|---|---|
| Conservative | Dorothy Wonnacott | 924 | |||
| Labour | James Hewitson | 839 | |||
| Labour | Anthony Johnston | 829 | |||
| Conservative | Mark Mallard | 812 | |||
| Labour | Edward Brenan | 798 | |||
| Conservative | Allan Mossop | 752 | |||
| Turnout | 4,954 | ||||
| Party | Candidate | Votes | % | ±% | |
|---|---|---|---|---|---|
| Independent | Anthony Wells | 616 | |||
| Labour | Joan Hully | 538 | |||
| Labour | William Southward | 511 | |||
| Labour | John Henney | 445 | |||
| Turnout | 2,110 | ||||
| Party | Candidate | Votes | % | ±% | |
|---|---|---|---|---|---|
| Labour | Catherine Giel | 679 | |||
| Labour | David Banks | 652 | |||
| Conservative | Hilda Morris | 194 | |||
| Liberal Democrats | Mike Minogue | 192 | |||
| Liberal Democrats | Stuart Bowers | 180 | |||
| Turnout | 1,897 | ||||
| Party | Candidate | Votes | % | ±% | |
|---|---|---|---|---|---|
| Labour | Willis Metherell | 992 | |||
| Labour | Brian Dixon | 963 | |||
| Labour | Kevin Young | 952 | |||
| Liberal Democrats | Frank Hollowell | 441 | |||
| Liberal Democrats | Mary Lancaster | 349 | |||
| Conservative | Joyce Toft | 231 | |||
| Liberal Democrats | Stephen Litt | 197 | |||
| Turnout | 4,125 | ||||
| Party | Candidate | Votes | % | ±% | |
|---|---|---|---|---|---|
| Labour | Samuel Meteer | 975 | |||
| Labour | Elaine Woodburn | 936 | |||
| Labour | Margaret Woodburn | 933 | |||
| Conservative | Steven Hill | 536 | |||
| Conservative | Alfred Bailey | 402 | |||
| Conservative | Elizabeth Hutson | 402 | |||
| Turnout | 4,184 | ||||
| Party | Candidate | Votes | % | ±% | |
|---|---|---|---|---|---|
| Labour | Michael McVeigh | 1,184 | |||
| Labour | Peter Watson | 1,043 | |||
| Labour | Constance Watson | 1,005 | |||
| Conservative | John Holmes | 592 | |||
| Conservative | Jean Lewthwaite | 572 | |||
| Conservative | Frederick Blinco | 537 | |||
| Turnout | 4,933 | ||||
| Party | Candidate | Votes | % | ±% | |
|---|---|---|---|---|---|
| Conservative | Robert Salkeld | 327 | 68.7 | ||
| Labour | Mary Ross | 149 | 31.3 | ||
| Majority | 178 | 37.4 | |||
| Turnout | 476 | ||||
| Party | Candidate | Votes | % | ±% | |
|---|---|---|---|---|---|
| Labour | Peter Connolly | 616 | |||
| Independent | James Close | 592 | |||
| Labour | Timothy Knowles | 425 | |||
| Turnout | 1,633 | ||||
| Party | Candidate | Votes | % | ±% | |
|---|---|---|---|---|---|
| Conservative | David Gray | 563 | 71.9 | ||
| Labour | Christina Cornall | 220 | 28.1 | ||
| Majority | 343 | 43.8 | |||
| Turnout | 783 | ||||
| Party | Candidate | Votes | % | ±% | |
|---|---|---|---|---|---|
| Labour | Janet Johnston | 987 | |||
| Labour | Henry Wormstrup | 944 | |||
| Labour | Paul Whalley | 901 | |||
| Conservative | Marcus Swift | 589 | |||
| Conservative | David Hall | 572 | |||
| Turnout | 3,993 | ||||
| Party | Candidate | Votes | % | ±% | |
|---|---|---|---|---|---|
| Liberal Democrats | Margaret Barnes | 317 | 50.6 | ||
| Conservative | Francis Cairns | 309 | 49.4 | ||
| Majority | 8 | 1.3 | |||
| Turnout | 626 | ||||
| Party | Candidate | Votes | % | ±% | |
|---|---|---|---|---|---|
| Labour | Norman Williams | 1,104 | |||
| Labour | Jamieson Reed | 970 | |||
| Labour | Margarita Docherty | 859 | |||
| Conservative | Gareth Maley | 436 | |||
| Turnout | 3,369 | ||||
| Party | Candidate | Votes | % | ±% | |
|---|---|---|---|---|---|
| Conservative | Alistair Norwood | 828 | |||
| Conservative | Andrew Wonnacott | 728 | |||
| Labour | John Woolley | 415 | |||
| Turnout | 1,971 | ||||
| Party | Candidate | Votes | % | ±% | |
|---|---|---|---|---|---|
| Labour | John Park | 683 | 38.9 | ||
| Conservative | Frederick Gleaves | 665 | 37.9 | ||
| Conservative | Alan Altree | 407 | 23.2 | ||
| Turnout | 1,755 | ||||
| Party | Candidate | Votes | % | ±% | |
|---|---|---|---|---|---|
| Labour | George Clements | 791 | |||
| Labour | Alan Holliday | 661 | |||
| Conservative | Leah Higgins | 262 | |||
| Turnout | 1,714 | ||||
| Party | Candidate | Votes | % | ±% | |
|---|---|---|---|---|---|
| Conservative | Gilbert Scurrah | unopposed | |||
| Party | Candidate | Votes | % | ±% | |
|---|---|---|---|---|---|
| Labour | Dorothy Faichney | 1,320 | |||
| Labour | Robert Docherty | 1,132 | |||
| Labour | Michael Ashbrook | 875 | |||
| Conservative | George Higgins | 305 | |||
| Conservative | Dorothy Gray | 204 | |||
| Turnout | 3,836 | ||||
| Party | Candidate | Votes | % | ±% | |
|---|---|---|---|---|---|
| Labour | Geoffrey Blackwell | 343 | 54.9 | ||
| Conservative | Edward Fox | 282 | 45.1 | ||
| Majority | 61 | 9.8 | |||
| Turnout | 625 | ||||
| Party | Candidate | Votes | % | ±% | |
|---|---|---|---|---|---|
| Conservative | Francis McPhillips | 905 | |||
| Conservative | Francis Heathcote | 898 | |||
| Conservative | Raymond Cole | 872 | |||
| Labour | Gavin Towers | 591 | |||
| Labour | Keith Crellin | 502 | |||
| Turnout | 3,768 | ||||
| Party | Candidate | Votes | % | ±% | |
|---|---|---|---|---|---|
| Conservative | Norman Clarkson | 575 | 74.6 | ||
| Labour | Archibald Ross | 196 | 25.4 | ||
| Majority | 379 | 49.2 | |||
| Turnout | 771 | ||||
| Party | Candidate | Votes | % | ±% | |
|---|---|---|---|---|---|
| Labour | Peter Tyson | 536 | |||
| Labour | James Prince | 360 | |||
| Independent | Gordon Brown | 291 | |||
| Conservative | Sheena Gray | 146 | |||
| Turnout | 1,333 | ||||
| Party | Candidate | Votes | % | ±% | |
|---|---|---|---|---|---|
| Conservative | David Moore | 1,147 | |||
| Conservative | Eileen Eastwood | 962 | |||
| Labour | Charles Tuley | 390 | |||
| Turnout | 2,499 | ||||
References
This article is issued from Wikipedia. The text is licensed under Creative Commons - Attribution - Sharealike. Additional terms may apply for the media files.