Dagohoy | |
|---|---|
| Municipality of Dagohoy | |
 Dagohoy, Bohol | |
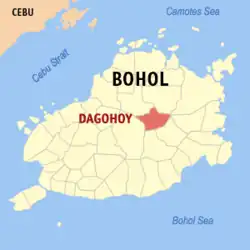
 Map of Bohol with Dagohoy highlighted | |
OpenStreetMap | |
.svg.png.webp) Dagohoy Location within the Philippines | |
| Coordinates: 9°55′N 124°17′E / 9.92°N 124.28°E | |
| Country | Philippines |
| Region | Central Visayas |
| Province | Bohol |
| District | 2nd district |
| Founded | 21 June 1956 |
| Named for | Francisco Dagohoy |
| Barangays | 15 (see Barangays) |
| Government | |
| • Type | Sangguniang Bayan |
| • Mayor | Germinio C. Relampagos, M.D |
| • Vice Mayor | Roel P. Lagroma |
| • Representative | Erico Aristotle C. Aumentado |
| • Municipal Council | Members |
| • Electorate | 13,425 voters (2022) |
| Area | |
| • Total | 77.59 km2 (29.96 sq mi) |
| Elevation | 151 m (495 ft) |
| Highest elevation | 424 m (1,391 ft) |
| Lowest elevation | 80 m (260 ft) |
| Population (2020 census)[3] | |
| • Total | 19,874 |
| • Density | 260/km2 (660/sq mi) |
| • Households | 4,547 |
| Economy | |
| • Income class | 5th municipal income class |
| • Poverty incidence | 27.50 |
| • Revenue | ₱ 95.64 million (2020) |
| • Assets | ₱ 238.6 million (2020) |
| • Expenditure | ₱ 113.3 million (2020) |
| • Liabilities | ₱ 70.69 million (2020) |
| Service provider | |
| • Electricity | Bohol 2 Electric Cooperative (BOHECO 2) |
| Time zone | UTC+8 (PST) |
| ZIP code | 6322 |
| PSGC | |
| IDD : area code | +63 (0)38 |
| Native languages | Boholano dialect Cebuano Tagalog |
Dagohoy, officially the Municipality of Dagohoy (Cebuano: Munisipalidad sa Dagohoy; Tagalog: Bayan ng Dagohoy), is a 5th class municipality in the province of Bohol, Philippines. According to the 2020 census, it has a population of 19,874 people.[3]
The town is named after Boholano revolutionary Francisco Dagohoy.
Dagohoy is 73 kilometres (45 mi) from Tagbilaran.
Dagohoy celebrates its fiesta on 10 February, to honor the town patron Our Lady of Lourdes.[5]
History
On 21 June 1956, the municipality of Dagohoy was created through Executive Order No. 184 issued by President Ramon Magsaysay, becoming the 41st town in the province.[6] Former Colonia agricultural colony superintendent Camilo Calceta was appointed first mayor of the town at the age of 84 years.[7] The barrios constituting the new municipality were:[6]
- from the municipality of Carmen
- Colonia
- San Vicente
- Can-oling
- La Esperanza
- Villa Aurora
- from the municipality of Ubay
- Babag
- from the municipality of Sierra Bullones
- Caluasan
- San Miguel
- Candelaria
- from the municipality of Trinidad
- Mahayag
- Malitbog
- Cagawasan
- Santo Rosario
Geography
Barangays
Dagohoy is politically subdivided into 15 barangays. Each barangay consists of puroks and some have sitios.
| PSGC | Barangay | Population | ±% p.a. | |||
|---|---|---|---|---|---|---|
| 2020[3] | 2010[8] | |||||
| 071217001 | Babag | 6.4% | 1,278 | 1,388 | −0.82% | |
| 071217005 | Cagawasan | 4.8% | 948 | 1,044 | −0.96% | |
| 071217006 | Cagawitan | 3.3% | 665 | 612 | 0.83% | |
| 071217007 | Caluasan | 9.5% | 1,892 | 1,816 | 0.41% | |
| 071217002 | Can‑oling | 3.9% | 772 | 985 | −2.41% | |
| 071217003 | Candelaria | 5.3% | 1,057 | 1,006 | 0.50% | |
| 071217004 | Estaca | 2.7% | 537 | 538 | −0.02% | |
| 071217008 | La Esperanza | 5.0% | 997 | 1,085 | −0.84% | |
| 071217009 | Mahayag | 5.1% | 1,016 | 987 | 0.29% | |
| 071217010 | Malitbog | 8.2% | 1,633 | 1,509 | 0.79% | |
| 071217011 | Poblacion | 13.5% | 2,692 | 2,646 | 0.17% | |
| 071217012 | San Miguel | 13.9% | 2,754 | 2,819 | −0.23% | |
| 071217013 | San Vicente | 7.0% | 1,386 | 1,374 | 0.09% | |
| 071217014 | Santa Cruz | 4.5% | 891 | 850 | 0.47% | |
| 071217015 | Villa Aurora | 2.3% | 456 | 443 | 0.29% | |
| Total | 19,874 | 18,868 | 0.52% | |||
Climate
| Climate data for Dagohoy, Bohol | |||||||||||||
|---|---|---|---|---|---|---|---|---|---|---|---|---|---|
| Month | Jan | Feb | Mar | Apr | May | Jun | Jul | Aug | Sep | Oct | Nov | Dec | Year |
| Mean daily maximum °C (°F) | 27 (81) |
28 (82) |
29 (84) |
30 (86) |
31 (88) |
30 (86) |
29 (84) |
30 (86) |
30 (86) |
29 (84) |
28 (82) |
28 (82) |
29 (84) |
| Mean daily minimum °C (°F) | 22 (72) |
22 (72) |
22 (72) |
23 (73) |
24 (75) |
24 (75) |
23 (73) |
23 (73) |
23 (73) |
23 (73) |
23 (73) |
23 (73) |
23 (73) |
| Average precipitation mm (inches) | 98 (3.9) |
82 (3.2) |
96 (3.8) |
71 (2.8) |
104 (4.1) |
129 (5.1) |
101 (4.0) |
94 (3.7) |
99 (3.9) |
135 (5.3) |
174 (6.9) |
143 (5.6) |
1,326 (52.3) |
| Average rainy days | 18.0 | 14.1 | 17.1 | 16.8 | 23.7 | 25.7 | 25.8 | 23.3 | 24.2 | 25.9 | 24.0 | 20.6 | 259.2 |
| Source: Meteoblue[9] | |||||||||||||
Demographics
|
|
| ||||||||||||||||||||||||||||||||||||||||||
| Source: Philippine Statistics Authority[10][8][11] | ||||||||||||||||||||||||||||||||||||||||||||
Economy

References
- ↑ Municipality of Dagohoy | (DILG)
- ↑ "2015 Census of Population, Report No. 3 – Population, Land Area, and Population Density" (PDF). Philippine Statistics Authority. Quezon City, Philippines. August 2016. ISSN 0117-1453. Archived (PDF) from the original on May 25, 2021. Retrieved July 16, 2021.
- 1 2 3 Census of Population (2020). "Region VII (Central Visayas)". Total Population by Province, City, Municipality and Barangay. Philippine Statistics Authority. Retrieved 8 July 2021.
- ↑ "PSA Releases the 2018 Municipal and City Level Poverty Estimates". Philippine Statistics Authority. 15 December 2021. Retrieved 22 January 2022.
- ↑ "Bohol Festivals Timetable". www.bohol-philippines.com. Retrieved 2019-03-14.
- 1 2 Executive Order No. 184 (21 June 1956), CREATING THE MUNICIPALITY OF DAGOHOY IN THE PROVINCE OF BOHOL (PDF)
- ↑ Bohol Chronicle 1958, pp. 1, 5.
- 1 2 Census of Population and Housing (2010). "Region VII (Central Visayas)" (PDF). Total Population by Province, City, Municipality and Barangay. National Statistics Office. Retrieved 29 June 2016.
- ↑ "Dagohoy: Average Temperatures and Rainfall". Meteoblue. Retrieved 9 May 2020.
- ↑ Census of Population (2015). "Region VII (Central Visayas)". Total Population by Province, City, Municipality and Barangay. Philippine Statistics Authority. Retrieved 20 June 2016.
- ↑ Censuses of Population (1903–2007). "Region VII (Central Visayas)". Table 1. Population Enumerated in Various Censuses by Province/Highly Urbanized City: 1903 to 2007. National Statistics Office.
{{cite encyclopedia}}: CS1 maint: numeric names: authors list (link) - ↑ "Poverty incidence (PI):". Philippine Statistics Authority.
- ↑ "Estimation of Local Poverty in the Philippines" (PDF). Philippine Statistics Authority. 29 November 2005.
- ↑ "2003 City and Municipal Level Poverty Estimates" (PDF). Philippine Statistics Authority. 23 March 2009.
- ↑ "City and Municipal Level Poverty Estimates; 2006 and 2009" (PDF). Philippine Statistics Authority. 3 August 2012.
- ↑ "City and Municipal Level Poverty Estimates; 2006 and 2009" (PDF). Philippine Statistics Authority. 3 August 2012.
- ↑ "2012 Municipal and City Level Poverty Estimates" (PDF). Philippine Statistics Authority. 31 May 2016.
- ↑ "Municipal and City Level Small Area Poverty Estimates; 2009, 2012 and 2015". Philippine Statistics Authority. 10 July 2019.
- ↑ "PSA Releases the 2018 Municipal and City Level Poverty Estimates". Philippine Statistics Authority. 15 December 2021. Retrieved 22 January 2022.
Sources
- Bohol Chronicle (11 Feb 1958). "A new town is born, ailing ex-superintendent named mayor". Archived from the original on 6 Aug 2022.