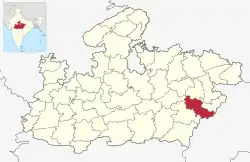
Dindori district | |
|---|---|
 Narmada in Dindori | |
 Location of Dindori district in Madhya Pradesh | |
| Country | |
| State | Madhya Pradesh |
| Division | Jabalpur |
| Headquarters | Dindori |
| Area | |
| • total | 6,128 km2 (2,366 sq mi) |
| Population (2011) | |
| • total | 704,524 |
| • Density | 110/km2 (300/sq mi) |
| Demographics | |
| • Literacy | 63.90% |
| • Sex ratio | 1002 |
| Time zone | UTC+05:30 (IST) |
| Website | dindori |
Dindori District, formerly known as Ramgarh District, is a district of Madhya Pradesh state of central India. The town of Dindori is the district headquarters. The district is part of Jabalpur Division. Total area of the district is 6,128 km2 (2,366 sq mi). It is located on the eastern part of Madhya Pradesh, bordering the state of Chhattisgarh. It is surrounded by Anuppur district to the northeast, Umaria district to the north, Jabalpur district to the west, Mandla district to the southwest and Mungeli and Kabirdham districts of Chhattisgarh to the south.
Economy
In 2006 the Ministry of Panchayati Raj named Dindori one of the country's 250 most backward districts (out of a total of 640).[1] It is one of the 24 districts in Madhya Pradesh currently receiving funds from the Backward Regions Grant Fund Programme (BRGF).[1]
Demographics
| Year | Pop. | ±% p.a. |
|---|---|---|
| 1901 | 111,229 | — |
| 1911 | 141,572 | +2.44% |
| 1921 | 135,008 | −0.47% |
| 1931 | 155,732 | +1.44% |
| 1941 | 176,280 | +1.25% |
| 1951 | 191,316 | +0.82% |
| 1961 | 263,940 | +3.27% |
| 1971 | 333,704 | +2.37% |
| 1981 | 409,677 | +2.07% |
| 1991 | 511,849 | +2.25% |
| 2001 | 580,730 | +1.27% |
| 2011 | 704,524 | +1.95% |
| source:[2] | ||
According to the 2011 census, Dindori District has a population of 704,524,[4] roughly equal to the nation of Bhutan[5] or the US state of Alaska.[6] This gives it a ranking of 501st in India (out of a total of 640).[4] The district has a population density of 94 inhabitants per square kilometre (240/sq mi) .[4] Its population growth rate over the decade 2001-2011 was 21.26%.[4] Dindori has a sex ratio of 1,002 females for every 1,000 males,[4] and a literacy rate of 63.90%. 4.59% of the population lives in urban areas. Scheduled Castes and Scheduled Tribes made up 5.65% and 64.69% of the population respectively. Gonds make up around 50% of the district's population.[4]
Languages
At the time of the 2011 Census of India, 82.78% of the population in the district spoke Hindi and 14.09% Gondi as their first language. 1.10% of the population spoke languages recorded as 'Other' under Hindi.[7]
Although most people return their language as "Hindi", the local dialect is mid-way between Chhattisgarhi and Bagheli.
References
- 1 2 Ministry of Panchayati Raj (September 8, 2009). "A Note on the Backward Regions Grant Fund Programme" (PDF). National Institute of Rural Development. Archived from the original (PDF) on April 5, 2012. Retrieved September 27, 2011.
- ↑ "Table A-02 Decadal Variation in Population Since 1901: Madhya Pradesh" (PDF). census.gov.in. Registrar General and Census Commissioner of India.
- ↑ "Table C-01 Population By Religion: Madhya Pradesh". census.gov.in. Registrar General and Census Commissioner of India.
- 1 2 3 4 5 6 "District Census Handbook: Rajgarh" (PDF). Census of India. Registrar General and Census Commissioner of India. 2011.
- ↑ US Directorate of Intelligence. "Country Comparison:Population". Archived from the original on June 13, 2007. Retrieved 2011-10-01.
Bhutan 708,427
- ↑ "2010 Resident Population Data". U. S. Census Bureau. Archived from the original on 2013-10-19. Retrieved 2011-09-30.
Alaska 710,231
- 1 2 "Table C-16 Population by Mother Tongue: Madhya Pradesh". censusindia.gov.in. Registrar General and Census Commissioner of India.