| ||
|---|---|---|
|
Chairman of the Central Committee of the Communist Party of the Russian Federation Incumbent Elections
|
||
Electoral history of Gennady Zyuganov, Member of the State Duma (1993–present), and Leader of Communist Party (1993–present). Communist presidential candidate, 1996, 2000, 2008 and 2012.
Presidential elections
1996

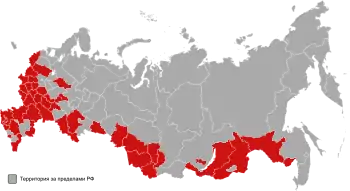
First round of 1996 election. Grey indicates a win by Yeltsin, red a win by Zyuganov.
| First round of 1996 presidential election | ||||||
|---|---|---|---|---|---|---|
| Candidate | Party | Votes | % | |||
| Boris Yeltsin | Independent | 26,665,495 | 35.8 | |||
| Gennady Zyuganov | Communist Party | 24,211,686 | 32.5 | |||
| Alexander Lebed | Congress of Russian Communities | 10,974,736 | 14.7 | |||
| Grigory Yavlinsky | Yabloko | 5,550,752 | 7.4 | |||
| Vladimir Zhirinovsky | Liberal Democratic Party | 4,311,479 | 5.8 | |||
| Svyatoslav Fyodorov | Party of Workers' Self-Government | 699,158 | 0.9 | |||
| Mikhail Gorbachev | Independent | 386,069 | 0.5 | |||
| Martin Shakkum | Independent | 277,068 | 0.4 | |||
| Yury Vlasov | Independent | 151,282 | 0.2 | |||
| Vladimir Bryntsalov | Russian Socialist Party | 123,065 | 0.2 | |||
| Aman Tuleyev | Independent | 308 | 0.0 | |||
| Against all | 1,163,921 | 1.6 | ||||
| Source: Nohlen & Stöver,[1] Colton[2] | ||||||

Second round of 1996 election. Grey indicates a win by Yeltsin, red a win by Zyuganov.
| Second round of 1996 presidential election | ||||||
|---|---|---|---|---|---|---|
| Candidate | Party | Votes | % | |||
| Boris Yeltsin | Independent | 40,203,948 | 54.4 | |||
| Gennady Zyuganov | Communist Party | 30,102,288 | 40.7 | |||
| Against all | 1,163,921 | 1.6 | ||||
| Source: Nohlen & Stöver,[3] Colton[4] | ||||||
2000

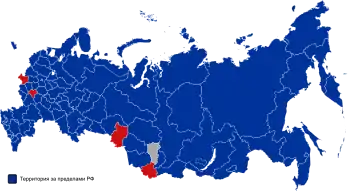
2000 election. Blue indicates a win by Putin, red a win by Zyuganov, grey a win by Tuleyev.
| 2000 presidential election | ||||
|---|---|---|---|---|
| Candidate | Party | Votes | % | |
| Vladimir Putin | Independent | 39,740,467 | 53.4 | |
| Gennady Zyuganov | Communist Party | 21,928,468 | 29.5 | |
| Grigory Yavlinsky | Yabloko | 4,351,450 | 5.9 | |
| Aman Tuleyev | Independent | 2,217,364 | 3.0 | |
| Vladimir Zhirinovsky | Liberal Democratic Party | 2,026,509 | 2.7 | |
| Konstantin Titov | Independent | 1,107,269 | 1.5 | |
| Ella Pamfilova | For Civic Dignity | 758,967 | 1.0 | |
| Stanislav Govorukhin | Independent | 328,723 | 0.4 | |
| Yury Skuratov | Independent | 319,189 | 0.4 | |
| Alexey Podberezkin | Spiritual Heritage | 98,177 | 0.1 | |
| Umar Dzhabrailov | Independent | 78,498 | 0.1 | |
| Against all | 1,414,673 | 1.9 | ||
| Source: Nohlen & Stöver, University of Essex | ||||
2008
| 2008 presidential election | ||||
|---|---|---|---|---|
| Candidates | Party | Votes | % | |
| Dmitry Medvedev | United Russia | 52,530,712 | 71.2 | |
| Gennady Zyuganov | Communist Party | 13,243,550 | 18.0 | |
| Vladimir Zhirinovsky | Liberal Democratic Party | 6,988,510 | 9.5 | |
| Andrei Bogdanov | Democratic Party | 968,344 | 1.3 | |
| Source: Nohlen & Stöver[5] | ||||
2012
| 2012 presidential election | ||||
|---|---|---|---|---|
| Candidates | Party | Votes | % | |
| Vladimir Putin | United Russia | 45,602,075 | 63.60 | |
| Gennady Zyuganov | Communist Party | 12,318,353 | 17.18 | |
| Mikhail Prokhorov | Independent | 5,722,508 | 7.98 | |
| Vladimir Zhirinovsky | Liberal Democratic Party | 4,458,103 | 6.22 | |
| Sergey Mironov | A Just Russia | 2,763,935 | 3.85 | |
| Source: Central Election Commission of the Russian Federation | ||||
References
- ↑ Nohlen, D; Stöver, P (2010). Elections in Europe: A data handbook. p. 1642. ISBN 978-3-8329-5609-7.
- ↑ Timothy J. Colton (2000). Transitional Citizens: Voters and What Influences Them in the New Russia. Harvard University Press. pp. 234–5. ISBN 9780674029804.
{{cite book}}:|work=ignored (help) - ↑ Nohlen, D; Stöver, P (2010). Elections in Europe: A data handbook. p. 1642. ISBN 978-3-8329-5609-7.
- ↑ Timothy J Colton (2000). Transitional Citizens: Voters and What Influences Them in the New Russia. Harvard University Press. pp. 234–5. ISBN 9780674029804.
{{cite book}}:|work=ignored (help) - ↑ Nohlen, D & Stöver, P (2010) Elections in Europe: A data handbook, p1661 ISBN 9783832956097
This article is issued from Wikipedia. The text is licensed under Creative Commons - Attribution - Sharealike. Additional terms may apply for the media files.

.jpg.webp)
