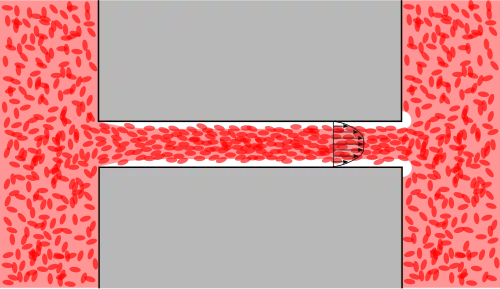
The Fåhræus effect is the decrease in average concentration of red blood cells in human blood as the diameter of the glass tube in which it is flowing decreases. In other words, in blood vessels with diameters less than 500 micrometers, the hematocrit decreases with decreasing capillary diameter. The Fåhræus effect definitely influences the Fåhræus–Lindqvist effect, which describes the dependence of apparent viscosity of blood on the capillary size, but the former is not the only cause of the latter.[1]
History
Robin Fåhræus was a pathologist at the University of Uppsala in Sweden, and his interest in the suspension stability of blood and later in hemorheology was motivated by the desire to understand the clinical effects of abnormalities in the aggregation and flow behavior of the formed elements. The aim was to ascertain whether blood obeyed the law of Poiseuille (Hagen–Poiseuille equation). It was Hess in 1915 who proved that blood obeys the poiseuille law at high flow and low shear. The non-Newtonian effects were due to the elastic deformation of red blood cells. Fahraeus entered the scene in 1917 through his observation that sedimentation velocity of red corpuscles increases during pregnancy. He used the concept of buffy coat as the starting point of his work on red cell sedimentation and the more general problem of suspension stability of blood. He pointed out that fibrinogen was the principal protein involved in red cell aggregation leading to the formation of regular rouleaux and that the process was quite distinct from blood coagulation. He applied colloid principles to describe the stability of the suspension and more relevant to modern circulatory psychology was the study of aggregation of streaming blood and the relation between blood cell distribution, its velocity and apparent viscosity. He concluded the following results: (a) In high flow rates in tubes of diameter (< 0.3 mm) the concentration of red cells is lower than large feed tube, the reason being that, red cells are distributed in the axial core and their mean velocity is therefore more than the mean velocity of blood. There is an inverse relationship between tube hematocrit and mean velocity of blood. (b) Viscosity in smaller tubes of < 0.3 mm is lower than that of large tube and decreases with decreasing diameter. (c) The migration of blood cells from the tube wall to the axis depends on the particle size and not on the particle density. (d) At low flow rates, the red cells aggregate into rouleaux and these being the largest particles in the suspension migrate to the axis forming a core that displaces the white cells to periphery. Therefore, the concentration of white cells will be greater than that of feed tube and their mean velocity will be lower than that of red cells and the plasma.
Mathematical model
Considering steady laminar fully developed blood flow in a small tube with radius of , whole blood separates into a cell-free plasma layer along the tube wall and enriched central core. As a result, the tube hematocrit is smaller than the out flow hematocrit . A simple mathematical treatment of the Fåhræus effect was shown in Sutera et al. (1970).[2] This seems to be the earliest analysis:
where:
- is the tube hematocrit
- is the outlet hematocrit
- is the cell-free plasma layer thickness
- is the radius of the tube
Also, the following expression was developed by Pries et al. (1990)[3] to represent tube hematocrit,, as a function of discharge hematocrit,, and tube diameter.
where:
- is the tube hematocrit
- is the discharge hematocrit
- is the diameter of the tube in µm
See also
References
- ↑ "Blood Flow and Fahraeus Effect". Nonoscience.info. 2010-09-02. Archived from the original on 2011-03-08. Retrieved 2011-05-09.
- ↑ Sutera, S.P.; Seshadri, V.; Croce, P.A.; Hochmuth, R.M. (1970). "Capillary blood flow: II. Deformable model cells in tube flow". Microvascular Research. 2 (4): 420–433. doi:10.1016/0026-2862(70)90035-X. PMID 5523939.
- ↑ Pries AR, Secomb TW, Gaehtgens P and Gross JF. Blood flow in microvascular networks: Experiments and simulation. Circulation Research 67:826–834, 1990.
Further reading
- C. Kleinstreuer, (2007) Bio-Fluid Dynamics, Taylor and Francis Pub.