Voiteg | |
|---|---|
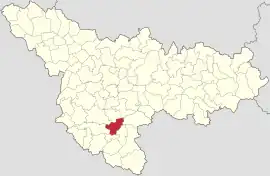
 Location in Timiș County | |
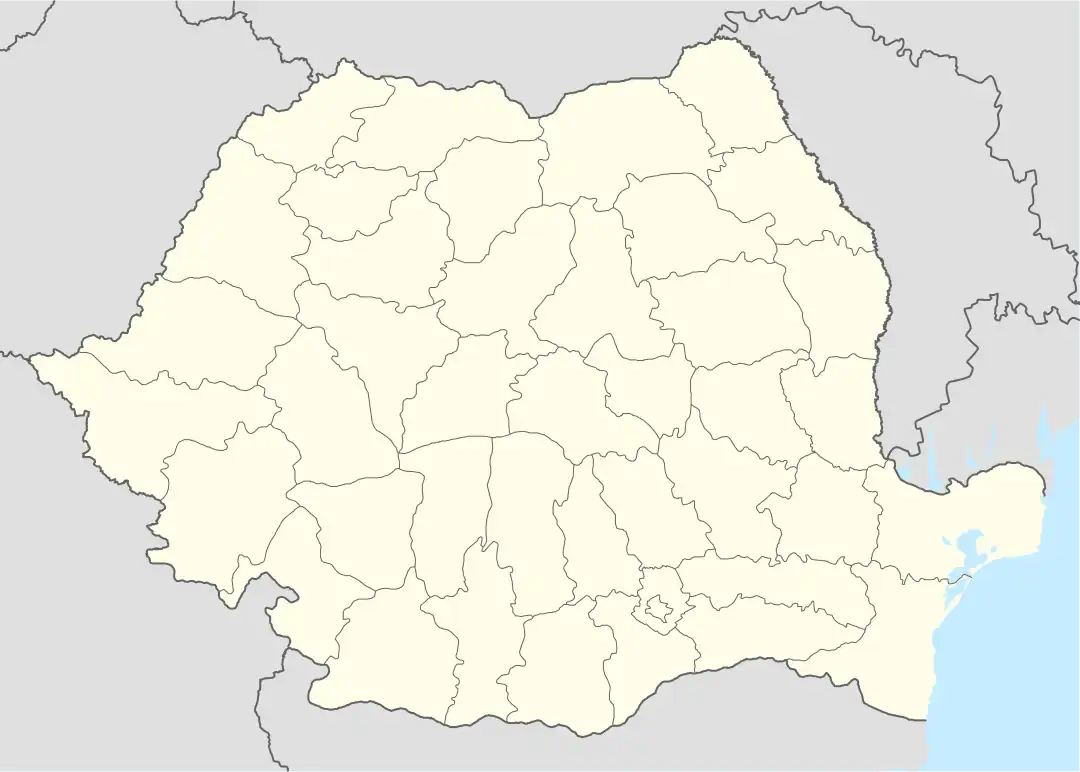
 Voiteg Location in Romania | |
| Coordinates: 45°28′N 21°14′E / 45.467°N 21.233°E | |
| Country | Romania |
| County | Timiș |
| Government | |
| • Mayor (2021–2024) | Nicolae-Ion Pop[1] (PNL) |
| Area | 69.62 km2 (26.88 sq mi) |
| Population (2021-12-01)[2] | 2,309 |
| • Density | 33/km2 (86/sq mi) |
| Time zone | EET/EEST (UTC+2/+3) |
| Postal code | 307470–307471 |
| Vehicle reg. | TM |
| Website | www |
Voiteg (Hungarian: Vejte; German: Wojtegg) is a commune in Timiș County, Romania. It is composed of two villages: Folea and Voiteg (commune seat).
History
Voiteg has existed since the 14th century, being first mentioned in 1322.[3] Its name was Veytech, after the owner Teodor Veytey. At that time, Voiteg was not where it is today, but a little further west of the railway. In 1332, in the papal tithe registers, the parish of Veytech is mentioned again.[3] According to Hungarian chronicles, in the past, the locals were part of the communes of Bolta and Vârceg, a proof of this being the local name that the inhabitants bore until the 20th century: vârcegani, those in the west and bolianți, those in the east. No other data is known about these two communes.
In 1842, German colonists began settling in Voiteg. The German population emigrated for the most part between 1990–1991. A 5.6-magnitude earthquake damaged more than 500 houses in Voiteg on 2 December 1991.[4]
Demographics
Voiteg had a population of 2,437 inhabitants at the 2011 census, up 0.4% from the 2002 census. Most inhabitants are Romanians (86.05%), larger minorities being represented by Hungarians (5.91%), Roma (2.63%) and Germans (2.01%). For 2.63% of the population, ethnicity is unknown.[5] By religion, most inhabitants are Orthodox (80.18%), but there are also minorities of Roman Catholics (9.52%), Pentecostals (3.08%) and Evangelicals (2.67%). For 2.63% of the population, religious affiliation is unknown.[6]
| Census[7] | Ethnic composition | |||||
|---|---|---|---|---|---|---|
| Year | Population | Romanians | Hungarians | Germans | Roma | Serbs |
| 1880 | 2,419 | 1,321 | 68 | 949 | – | 69 |
| 1890 | 3,301 | 1,453 | 316 | 1,449 | – | 79 |
| 1900 | 3,345 | 1,499 | 309 | 1,448 | – | 77 |
| 1910 | 3,182 | 1,539 | 350 | 1,249 | – | 20 |
| 1920 | 3,100 | 1,517 | 305 | 1,266 | – | – |
| 1930 | 3,140 | 1,595 | 355 | 1,174 | – | 11 |
| 1941 | 3,294 | 1,672 | 381 | 1,217 | – | – |
| 1956 | 2,923 | 1,894 | 414 | 586 | – | 25 |
| 1966 | 2,719 | 1,875 | 282 | 537 | – | 18 |
| 1977 | 2,908 | 2,150 | 282 | 454 | 4 | 14 |
| 1992 | 2,399 | 1,993 | 205 | 140 | 35 | 11 |
| 2002 | 2,427 | 2,136 | 174 | 70 | 34 | 4 |
| 2011 | 2,437 | 2,097 | 144 | 49 | 64 | 3 |
References
- ↑ "Results of the 2021 local elections". Central Electoral Bureau. Retrieved 30 June 2021.
- ↑ "Populaţia rezidentă după grupa de vârstă, pe județe și municipii, orașe, comune, la 1 decembrie 2021" (XLS). National Institute of Statistics.
- 1 2 Szabó, M. Attila (2003). Erdély, Bánság és Partium történeti és közigazgatási helységnévtára. Miercurea Ciuc: Pro-Print Kiadó.
- ↑ Marin, Marin; Roman, Luiza; Roman, Octavian (2011). "Seismele din zona Banat – Timișoara" (PDF). Buletinul AGIR (2): 23–27.
- 1 2 "Tab8. Populația stabilă după etnie – județe, municipii, orașe, comune". Institutul Național de Statistică.
- 1 2 "Tab13. Populația stabilă după religie – județe, municipii, orașe, comune". Institutul Național de Statistică.
- ↑ Varga, E. Árpád. "Temes megye településeinek etnikai (anyanyelvi/nemzetiségi) adatai 1880-2002" (PDF).
