| French-speaking electoral college | |
|---|---|
| European Parliament constituency | |
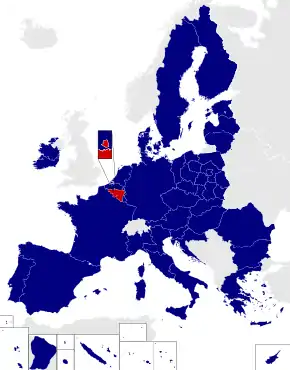
 Location among the current constituencies | |
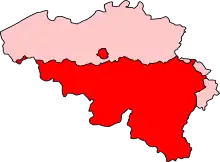
 Shown within Belgium | |
| Member state | Belgium |
| Created | 1979 |
| MEPs | 8 |
| Sources | |
The French-speaking electoral college is one of three constituencies of the European Parliament in Belgium. It currently elects 8 MEPs using the D'Hondt method of party-list proportional representation. It elected 9 MEPs until the 2007 accession of Bulgaria and Romania.
Prior to the 1999 elections, electors in the German-speaking community were voting in the French-speaking electoral college, along with the rest of the Walloon region where they are located; they vote now in their own German-speaking electoral college.
Boundaries
The constituency corresponds to the French Community of Belgium. In officially bilingual Brussels, electors can choose between lists of this electoral college or those of the Dutch-speaking electoral college.
Prior to the 2011–2012 state reform, electors could choose between both lists not only in Brussels, but in an area encompassing unilingually Dutch territory, Brussels-Halle-Vilvoorde. Some towns in the officially Dutch-speaking Brussels Periphery still have this option however.
Members of the European Parliament
2019–2024
2014–2019
2009–2014
2004–2009
Election results
2019
| Party | Affiliation | Votes | % | Change | Seats | Change | |
|---|---|---|---|---|---|---|---|
| Socialist Party (PS) | PES | 651,157 | 26.69 | 2 | |||
| Ecolo | EGP | 485,655 | 19.91 | 2 | |||
| Reformist Movement (MR) | ELDR | 470,654 | 19.29 | 2 | |||
| Workers Party of Belgium (PTB) | None | 355,883 | 14.59 | 1 | |||
| Humanist Democratic Centre (CDH) | EPP | 218,078 | 8.94 | 1 | |||
| DéFI | None | 144,555 | 5.92 | 0 | |||
| People's Party (PP) | None | 113,793 | 4.66 | 0 | |||
| Total | 2,439,775 | 100 | – | 8 | |||
2014
| Party | Affiliation | Votes | % | Change | Seats | Change | |
|---|---|---|---|---|---|---|---|
| Socialist Party (PS) | PES | 714,645 | 29.29 | 3 | |||
| Reformist Movement (MR) | ELDR | 661,332 | 27.10 | 3 | |||
| Ecolo | EGP | 285,196 | 11.69 | 1 | |||
| Humanist Democratic Centre (CDH) | EPP | 277,246 | 11.36 | 1 | |||
| People's Party (PP) | ADDE | 145,909 | 5.98 | 0 | |||
| Workers Party of Belgium (PTB) | None | 133,811 | 5.48 | 0 | |||
| Francophone Democratic Federalists (FDF) | None | 82,540 | 3.38 | 0 | |||
| Debout Les Belges! (DLB!) | None | 72,671 | 2.98 | 0 | |||
| La Droite | None | 38,813 | 1.59 | 0 | |||
| Vega | None | 15,208 | 0.62 | 0 | |||
| Stand Up USE | None | 7,970 | 0.33 | 0 | |||
| MG | None | 4,705 | 0.19 | 0 | |||
| Total | 2,440,046 | 100 | – | 8 | |||
2009
| Party | Affiliation | Votes | % | Change | Seats | Change | |
|---|---|---|---|---|---|---|---|
| Socialist Party (PS) | PES | 714,947 | 29.10 | 3 | |||
| Reformist Movement (MR) | ELDR | 640,092 | 26.05 | 2 | |||
| Ecolo | EGP | 562,081 | 22.88 | 2 | |||
| Humanist Democratic Centre (CDH) | EPP | 327,824 | 13.34 | 1 | 0 | ||
| National Front (FN) | None | 87,706 | 3.57 | 0 | 0 | ||
| Workers Party of Belgium+ (PTB) | None | 28,483 | 1.16 | 0 | 0 | ||
| Others | 96,045 | 3.91 | – | 0 | – | ||
| Total | 2,457,178 | 100 | – | 8 | |||
2004
| Party | Votes | % | Change | Seats | |
|---|---|---|---|---|---|
| Socialist Party (PS) | 878,577 | 36.09 | +10.31 | 4 | +1 |
| Reformist Movement (MR) | 671,422 | 27.58 | +0.59 | 3 | 0 |
| Democratic Humanist Centre (CDH) | 368,753 | 15.15 | +1.84 | 1 | +1 |
| Ecologists (Ecolo) | 239,687 | 9.84 | −12.86 | 1 | −2 |
| National Front (FN) | 181,351 | 7.45 | +3.35 | 0 | 0 |
| New Belgian Front (FNB) | 26,775 | 1.1 | +0.03 | 0 | 0 |
| Rassemblement Wallonie-France (RWF) | 23,090 | 0.95 | N/A | 0 | |
| CDF | 19,718 | 0.81 | N/A | 0 | |
| Workers' Party of Belgium (PTB+) | 19,645 | 0.81 | N/A | 0 | |
| Movement for a Socialist Alternative (MAS) | 5,675 | 0.23 | N/A | 0 | |
| Total | 2,434,693 | 9 | |||
References
- ↑ Paul Magnette was originally elected but he opted not to take his seat.