| Gentofte | |
|---|---|
| Gentofte | |
| Nomination district constituency for the Folketing | |
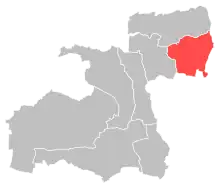 Location of Gentofte within Greater Copenhagen | |
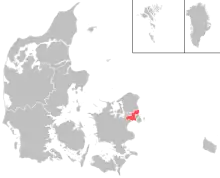 Location of Greater Copenhagen within Denmark | |
| Municipalities | Gentofte |
| Constituency | Greater Copenhagen |
| Electorate | 50,631 (2022)[1] |
| Current constituency | |
| Created | 1915[2] |
Gentofte nominating district is one of the 92 nominating districts that exists for Danish elections following the 2007 municipal reform.[3][4][5] It consists of Gentofte Municipality.[6] It was created in 1915[7] with its current boundary, though from 1950 to 2007 the other half of the municipality was part of a separate Hellerup nomination district.[8]
In general elections, the district is a very strong area for parties commonly associated with the blue bloc.[9]
General elections results
General elections in the 2020s
| Parties | Vote | |||||
|---|---|---|---|---|---|---|
| Votes | % | + / - | ||||
| Venstre | 7,526 | 16.76 | -8.47 | |||
| Conservatives | 6,546 | 14.58 | -6.02 | |||
| Moderates | 6,462 | 14.39 | New | |||
| Liberal Alliance | 6,449 | 14.36 | +9.59 | |||
| Social Democrats | 5,717 | 12.73 | +1.20 | |||
| Social Liberals | 3,026 | 6.74 | -7.96 | |||
| Green Left | 2,747 | 6.12 | -0.08 | |||
| Red–Green Alliance | 1,809 | 4.03 | -1.11 | |||
| The Alternative | 1,698 | 3.78 | +0.91 | |||
| New Right | 930 | 2.07 | -0.15 | |||
| Danish People's Party | 906 | 2.02 | -1.59 | |||
| Denmark Democrats | 747 | 1.66 | New | |||
| Independent Greens | 200 | 0.45 | New | |||
| Christian Democrats | 93 | 0.21 | -0.72 | |||
| Jovan Tasevski | 32 | 0.07 | New | |||
| Henrik Vendelbo Petersen | 19 | 0.04 | New | |||
| Total | 44,907 | |||||
| Source[10] | ||||||
General elections in the 2010s
| Parties | Vote | |||||
|---|---|---|---|---|---|---|
| Votes | % | + / - | ||||
| Venstre | 11,300 | 25.23 | +3.91 | |||
| Conservatives | 9,226 | 20.60 | +10.49 | |||
| Social Liberals | 6,586 | 14.70 | +5.63 | |||
| Social Democrats | 5,163 | 11.53 | -5.91 | |||
| Green Left | 2,779 | 6.20 | +2.97 | |||
| Red–Green Alliance | 2,300 | 5.14 | -0.03 | |||
| Liberal Alliance | 2,138 | 4.77 | -12.72 | |||
| Danish People's Party | 1,617 | 3.61 | -6.88 | |||
| The Alternative | 1,286 | 2.87 | -2.46 | |||
| New Right | 995 | 2.22 | New | |||
| Stram Kurs | 501 | 1.12 | New | |||
| Christian Democrats | 415 | 0.93 | +0.63 | |||
| Klaus Riskær Pedersen Party | 378 | 0.84 | New | |||
| Mads Palsvig | 105 | 0.23 | New | |||
| Christian B. Olesen | 1 | 0.00 | New | |||
| Total | 44,790 | |||||
| Source[11] | ||||||
| Parties | Vote | |||||
|---|---|---|---|---|---|---|
| Votes | % | + / - | ||||
| Venstre | 9,600 | 21.32 | -9.50 | |||
| Liberal Alliance | 7,876 | 17.49 | +7.28 | |||
| Social Democrats | 7,850 | 17.44 | +5.58 | |||
| Danish People's Party | 4,722 | 10.49 | +3.61 | |||
| Conservatives | 4,553 | 10.11 | -4.89 | |||
| Social Liberals | 4,083 | 9.07 | -6.00 | |||
| The Alternative | 2,399 | 5.33 | New | |||
| Red–Green Alliance | 2,327 | 5.17 | +0.06 | |||
| Green Left | 1,452 | 3.23 | -1.53 | |||
| Christian Democrats | 135 | 0.30 | +0.04 | |||
| Asif Ahmad | 15 | 0.03 | New | |||
| Christian Olesen | 7 | 0.02 | New | |||
| Total | 45,019 | |||||
| Source[12] | ||||||
| Parties | Vote | |||||
|---|---|---|---|---|---|---|
| Votes | % | + / - | ||||
| Venstre | 13,877 | 30.82 | +5.31 | |||
| Social Liberals | 6,787 | 15.07 | +7.07 | |||
| Conservatives | 6,755 | 15.00 | -12.80 | |||
| Social Democrats | 5,342 | 11.86 | -1.80 | |||
| Liberal Alliance | 4,599 | 10.21 | +4.69 | |||
| Danish People's Party | 3,099 | 6.88 | -0.99 | |||
| Red–Green Alliance | 2,299 | 5.11 | +2.72 | |||
| Green Left | 2,142 | 4.76 | -4.10 | |||
| Christian Democrats | 116 | 0.26 | -0.13 | |||
| Christian H. Hansen | 17 | 0.04 | New | |||
| Total | 45,033 | |||||
| Source[13] | ||||||
General elections in the 2000s
| Parties | Vote | |||||
|---|---|---|---|---|---|---|
| Votes | % | + / - | ||||
| Conservatives | 12,080 | 27.80 | +1.83 | |||
| Venstre | 11,085 | 25.51 | -1.69 | |||
| Social Democrats | 5,938 | 13.66 | +0.01 | |||
| Green Left | 3,851 | 8.86 | +3.53 | |||
| Social Liberals | 3,477 | 8.00 | -5.42 | |||
| Danish People's Party | 3,420 | 7.87 | -1.15 | |||
| New Alliance | 2,399 | 5.52 | New | |||
| Red–Green Alliance | 1,038 | 2.39 | -0.64 | |||
| Christian Democrats | 170 | 0.39 | -0.61 | |||
| Feride Istogu Gillesberg | 0 | 0.00 | New | |||
| Janus Kramer Møller | 0 | 0.00 | New | |||
| Total | 43,458 | |||||
| Source[14] | ||||||
| Parties | Vote | |||||
|---|---|---|---|---|---|---|
| Votes | % | + / - | ||||
| Venstre | 5,780 | 27.20 | -7.79 | |||
| Conservatives | 5,519 | 25.97 | +8.57 | |||
| Social Democrats | 2,901 | 13.65 | -2.81 | |||
| Social Liberals | 2,852 | 13.42 | +4.87 | |||
| Danish People's Party | 1,916 | 9.02 | +0.41 | |||
| Green Left | 1,132 | 5.33 | -0.67 | |||
| Red–Green Alliance | 643 | 3.03 | +0.62 | |||
| Centre Democrats | 246 | 1.16 | -2.20 | |||
| Christian Democrats | 213 | 1.00 | -0.96 | |||
| Minority Party | 46 | 0.22 | New | |||
| Nahid Yazdanyar | 2 | 0.01 | New | |||
| Total | 21,250 | |||||
| Source[15] | ||||||
| Parties | Vote | |||||
|---|---|---|---|---|---|---|
| Votes | % | + / - | ||||
| Venstre | 7,697 | 34.99 | +8.58 | |||
| Conservatives | 3,828 | 17.40 | -3.46 | |||
| Social Democrats | 3,621 | 16.46 | -3.46 | |||
| Danish People's Party | 1,893 | 8.61 | +1.56 | |||
| Social Liberals | 1,880 | 8.55 | +2.71 | |||
| Green Left | 1,319 | 6.00 | -0.98 | |||
| Centre Democrats | 740 | 3.36 | -3.88 | |||
| Red–Green Alliance | 530 | 2.41 | -0.20 | |||
| Christian People's Party | 432 | 1.96 | +0.06 | |||
| Progress Party | 56 | 0.25 | -0.53 | |||
| Total | 21,996 | |||||
| Source[16] | ||||||
General elections in the 1990s
| Parties | Vote | |||||
|---|---|---|---|---|---|---|
| Votes | % | + / - | ||||
| Venstre | 5,842 | 26.41 | +3.94 | |||
| Conservatives | 4,614 | 20.86 | -11.66 | |||
| Social Democrats | 4,408 | 19.92 | +2.43 | |||
| Centre Democrats | 1,602 | 7.24 | +2.48 | |||
| Danish People's Party | 1,560 | 7.05 | New | |||
| Green Left | 1,545 | 6.98 | +0.79 | |||
| Social Liberals | 1,292 | 5.84 | -1.12 | |||
| Red–Green Alliance | 577 | 2.61 | -0.10 | |||
| Christian People's Party | 421 | 1.90 | +0.78 | |||
| Progress Party | 172 | 0.78 | -3.63 | |||
| Democratic Renewal | 51 | 0.23 | New | |||
| Mogens Glistrup | 32 | 0.14 | -0.21 | |||
| Anders Kofoed | 5 | 0.02 | New | |||
| Poul Bregninge | 2 | 0.01 | New | |||
| Total | 22,123 | |||||
| Source[17] | ||||||
| Parties | Vote | |||||
|---|---|---|---|---|---|---|
| Votes | % | + / - | ||||
| Conservatives | 7,344 | 32.52 | -0.61 | |||
| Venstre | 5,076 | 22.47 | +7.49 | |||
| Social Democrats | 3,951 | 17.49 | -2.49 | |||
| Social Liberals | 1,571 | 6.96 | +1.05 | |||
| Green Left | 1,397 | 6.19 | -0.66 | |||
| Centre Democrats | 1,075 | 4.76 | -4.13 | |||
| Progress Party | 996 | 4.41 | +0.33 | |||
| Red–Green Alliance | 613 | 2.71 | +0.87 | |||
| Christian People's Party | 252 | 1.12 | -0.47 | |||
| Niels I. Meyer | 185 | 0.82 | New | |||
| Mogens Glistrup | 78 | 0.35 | New | |||
| Preben Møller Hansen | 39 | 0.17 | New | |||
| John Ziegler | 5 | 0.02 | New | |||
| Torben Faber | 4 | 0.02 | New | |||
| Total | 22,586 | |||||
| Source[18] | ||||||
| Parties | Vote | |||||
|---|---|---|---|---|---|---|
| Votes | % | + / - | ||||
| Conservatives | 7,193 | 33.13 | -3.21 | |||
| Social Democrats | 4,338 | 19.98 | +5.81 | |||
| Venstre | 3,251 | 14.98 | +5.07 | |||
| Centre Democrats | 1,929 | 8.89 | -0.20 | |||
| Green Left | 1,486 | 6.85 | -2.86 | |||
| Social Liberals | 1,283 | 5.91 | -2.42 | |||
| Progress Party | 885 | 4.08 | -2.48 | |||
| Red–Green Alliance | 399 | 1.84 | New | |||
| Christian People's Party | 345 | 1.59 | +0.32 | |||
| Common Course | 297 | 1.37 | +0.38 | |||
| The Greens | 206 | 0.95 | -1.39 | |||
| Justice Party of Denmark | 89 | 0.41 | New | |||
| Humanist Party | 8 | 0.04 | New | |||
| Total | 21,709 | |||||
| Source[19] | ||||||
General elections in the 1980s
| Parties | Vote | |||||
|---|---|---|---|---|---|---|
| Votes | % | + / - | ||||
| Conservatives | 8,176 | 36.34 | -2.15 | |||
| Social Democrats | 3,189 | 14.17 | +0.48 | |||
| Venstre | 2,229 | 9.91 | +4.18 | |||
| Green Left | 2,184 | 9.71 | -1.14 | |||
| Centre Democrats | 2,045 | 9.09 | -0.52 | |||
| Social Liberals | 1,874 | 8.33 | -1.67 | |||
| Progress Party | 1,475 | 6.56 | +2.78 | |||
| The Greens | 527 | 2.34 | +0.23 | |||
| Christian People's Party | 285 | 1.27 | -0.48 | |||
| Common Course | 222 | 0.99 | -0.07 | |||
| Left Socialists | 159 | 0.71 | -0.95 | |||
| Communist Party of Denmark | 132 | 0.59 | -0.14 | |||
| Leif Hilt | 2 | 0.01 | New | |||
| Total | 22,499 | |||||
| Source[20] | ||||||
| Parties | Vote | |||||
|---|---|---|---|---|---|---|
| Votes | % | + / - | ||||
| Conservatives | 8,780 | 38.49 | -1.88 | |||
| Social Democrats | 3,122 | 13.69 | -2.41 | |||
| Green Left | 2,476 | 10.85 | +1.28 | |||
| Social Liberals | 2,281 | 10.00 | +1.73 | |||
| Centre Democrats | 2,192 | 9.61 | +3.04 | |||
| Venstre | 1,307 | 5.73 | -2.58 | |||
| Progress Party | 862 | 3.78 | +0.65 | |||
| The Greens | 482 | 2.11 | New | |||
| Christian People's Party | 400 | 1.75 | -0.08 | |||
| Left Socialists | 378 | 1.66 | -2.27 | |||
| Common Course | 241 | 1.06 | New | |||
| Communist Party of Denmark | 166 | 0.73 | +0.19 | |||
| Justice Party of Denmark | 79 | 0.35 | -0.98 | |||
| Humanist Party | 37 | 0.16 | New | |||
| Socialist Workers Party | 6 | 0.03 | 0.00 | |||
| Marxist–Leninists Party | 3 | 0.01 | 0.00 | |||
| Carsten Grøn-Nielsen | 0 | 0.00 | -0.01 | |||
| Per Hillersborg | 0 | 0.00 | New | |||
| Total | 22,812 | |||||
| Source[21] | ||||||
| Parties | Vote | |||||
|---|---|---|---|---|---|---|
| Votes | % | + / - | ||||
| Conservatives | 9,518 | 40.37 | +6.77 | |||
| Social Democrats | 3,795 | 16.10 | -1.72 | |||
| Green Left | 2,257 | 9.57 | +0.34 | |||
| Venstre | 1,958 | 8.31 | +2.45 | |||
| Social Liberals | 1,950 | 8.27 | +1.76 | |||
| Centre Democrats | 1,549 | 6.57 | -3.56 | |||
| Left Socialists | 926 | 3.93 | -0.06 | |||
| Progress Party | 738 | 3.13 | -6.09 | |||
| Christian People's Party | 431 | 1.83 | +0.60 | |||
| Justice Party of Denmark | 313 | 1.33 | -0.16 | |||
| Communist Party of Denmark | 128 | 0.54 | -0.23 | |||
| Socialist Workers Party | 7 | 0.03 | -0.01 | |||
| Marxist–Leninists Party | 2 | 0.01 | New | |||
| Carsten Grøn-Nielsen | 2 | 0.01 | New | |||
| Mogens Nebelong | 1 | 0.00 | -0.01 | |||
| Poul Rasmussen | 0 | 0.00 | New | |||
| Total | 23,575 | |||||
| Source[22] | ||||||
| Parties | Vote | |||||
|---|---|---|---|---|---|---|
| Votes | % | + / - | ||||
| Conservatives | 7,475 | 33.60 | +2.86 | |||
| Social Democrats | 3,963 | 17.82 | -5.09 | |||
| Centre Democrats | 2,253 | 10.13 | +5.53 | |||
| Green Left | 2,054 | 9.23 | +4.93 | |||
| Progress Party | 2,051 | 9.22 | -1.03 | |||
| Social Liberals | 1,449 | 6.51 | -1.09 | |||
| Venstre | 1,304 | 5.86 | -3.72 | |||
| Left Socialists | 887 | 3.99 | -0.87 | |||
| Justice Party of Denmark | 331 | 1.49 | -1.00 | |||
| Christian People's Party | 274 | 1.23 | -0.15 | |||
| Communist Party of Denmark | 171 | 0.77 | -0.27 | |||
| Communist Workers Party | 20 | 0.09 | -0.17 | |||
| Socialist Workers Party | 9 | 0.04 | New | |||
| Mogens Nebelong | 3 | 0.01 | New | |||
| Total | 22,244 | |||||
| Source[23] | ||||||
General elections in the 1970s
| Parties | Vote | |||||
|---|---|---|---|---|---|---|
| Votes | % | + / - | ||||
| Conservatives | 7,112 | 30.74 | +6.77 | |||
| Social Democrats | 5,299 | 22.91 | -1.54 | |||
| Progress Party | 2,371 | 10.25 | -4.79 | |||
| Venstre | 2,216 | 9.58 | +1.98 | |||
| Social Liberals | 1,757 | 7.60 | +3.38 | |||
| Left Socialists | 1,124 | 4.86 | +1.37 | |||
| Centre Democrats | 1,064 | 4.60 | -5.39 | |||
| Green Left | 994 | 4.30 | +1.11 | |||
| Justice Party of Denmark | 576 | 2.49 | -0.94 | |||
| Christian People's Party | 319 | 1.38 | -0.80 | |||
| Communist Party of Denmark | 241 | 1.04 | -0.78 | |||
| Communist Workers Party | 60 | 0.26 | New | |||
| Total | 23,133 | |||||
| Source[24] | ||||||
| Parties | Vote | |||||
|---|---|---|---|---|---|---|
| Votes | % | + / - | ||||
| Social Democrats | 5,710 | 24.45 | +7.81 | |||
| Conservatives | 5,598 | 23.97 | +8.90 | |||
| Progress Party | 3,513 | 15.04 | -0.13 | |||
| Centre Democrats | 2,333 | 9.99 | +7.08 | |||
| Venstre | 1,776 | 7.60 | -19.73 | |||
| Social Liberals | 986 | 4.22 | -3.35 | |||
| Left Socialists | 816 | 3.49 | +0.57 | |||
| Justice Party of Denmark | 800 | 3.43 | +1.61 | |||
| Green Left | 745 | 3.19 | -1.06 | |||
| Christian People's Party | 509 | 2.18 | -1.75 | |||
| Communist Party of Denmark | 426 | 1.82 | -0.57 | |||
| Pensioners' Party | 144 | 0.62 | New | |||
| Poul Rasmussen | 1 | 0.00 | New | |||
| Otto Jensen | 0 | 0.00 | New | |||
| Total | 23,357 | |||||
| Source[25] | ||||||
| Parties | Vote | |||||
|---|---|---|---|---|---|---|
| Votes | % | + / - | ||||
| Venstre | 6,537 | 27.33 | +14.93 | |||
| Social Democrats | 3,980 | 16.64 | +2.96 | |||
| Progress Party | 3,630 | 15.17 | -2.76 | |||
| Conservatives | 3,605 | 15.07 | -5.88 | |||
| Social Liberals | 1,810 | 7.57 | -3.80 | |||
| Green Left | 1,017 | 4.25 | -1.22 | |||
| Christian People's Party | 940 | 3.93 | +1.17 | |||
| Left Socialists | 698 | 2.92 | +0.88 | |||
| Centre Democrats | 695 | 2.91 | -4.98 | |||
| Communist Party of Denmark | 572 | 2.39 | -0.46 | |||
| Justice Party of Denmark | 435 | 1.82 | -0.82 | |||
| J. G. Amdrejcak | 1 | 0.00 | New | |||
| Kai Clemmensen | 1 | 0.00 | New | |||
| Henning Glahn | 1 | 0.00 | New | |||
| Poul Friborg | 0 | 0.00 | New | |||
| Total | 23,922 | |||||
| Source[26] | ||||||
| Parties | Vote | |||||
|---|---|---|---|---|---|---|
| Votes | % | + / - | ||||
| Conservatives | 5,204 | 20.95 | -21.05 | |||
| Progress Party | 4,454 | 17.93 | New | |||
| Social Democrats | 3,400 | 13.68 | -5.13 | |||
| Venstre | 3,082 | 12.40 | +2.92 | |||
| Social Liberals | 2,826 | 11.37 | -4.09 | |||
| Centre Democrats | 1,961 | 7.89 | New | |||
| Green Left | 1,360 | 5.47 | -2.32 | |||
| Communist Party of Denmark | 707 | 2.85 | +1.83 | |||
| Christian People's Party | 685 | 2.76 | +1.65 | |||
| Justice Party of Denmark | 657 | 2.64 | +0.89 | |||
| Left Socialists | 507 | 2.04 | -0.26 | |||
| Erik Dissing | 2 | 0.01 | New | |||
| Total | 24,845 | |||||
| Source[27] | ||||||
| Parties | Vote | |||||
|---|---|---|---|---|---|---|
| Votes | % | + / - | ||||
| Conservatives | 10,332 | 42.00 | -8.06 | |||
| Social Democrats | 4,626 | 18.81 | +1.38 | |||
| Social Liberals | 3,803 | 15.46 | -0.43 | |||
| Venstre | 2,331 | 9.48 | +2.97 | |||
| Green Left | 1,915 | 7.79 | +3.97 | |||
| Left Socialists | 566 | 2.30 | 0.00 | |||
| Justice Party of Denmark | 430 | 1.75 | +1.32 | |||
| Christian People's Party | 274 | 1.11 | New | |||
| Communist Party of Denmark | 250 | 1.02 | +0.31 | |||
| Henning Berthelsen | 71 | 0.29 | New | |||
| Total | 24,598 | |||||
| Source[28] | ||||||
General elections in the 1960s
| Parties | Vote | |||||
|---|---|---|---|---|---|---|
| Votes | % | + / - | ||||
| Conservatives | 13,507 | 50.06 | +3.81 | |||
| Social Democrats | 4,702 | 17.43 | -2.44 | |||
| Social Liberals | 4,288 | 15.89 | +7.95 | |||
| Venstre | 1,756 | 6.51 | -2.70 | |||
| Green Left | 1,030 | 3.82 | -4.78 | |||
| Liberal Centre | 636 | 2.36 | -2.27 | |||
| Left Socialists | 620 | 2.30 | New | |||
| Communist Party of Denmark | 191 | 0.71 | +0.06 | |||
| Independent Party | 139 | 0.52 | -1.90 | |||
| Justice Party of Denmark | 115 | 0.43 | 0.00 | |||
| H. Søndersted Andersen | 2 | 0.01 | New | |||
| Kirsten Lonning | 2 | 0.01 | New | |||
| Thode Karlsen | 0 | 0.00 | -0.01 | |||
| Total | 26,984 | |||||
| Source[29] | ||||||
| Parties | Vote | |||||
|---|---|---|---|---|---|---|
| Votes | % | + / - | ||||
| Conservatives | 12,464 | 46.25 | -2.74 | |||
| Social Democrats | 5,356 | 19.87 | -3.98 | |||
| Venstre | 2,482 | 9.21 | -2.45 | |||
| Green Left | 2,318 | 8.60 | +4.39 | |||
| Social Liberals | 2,141 | 7.94 | +3.38 | |||
| Liberal Centre | 1,247 | 4.63 | New | |||
| Independent Party | 651 | 2.42 | -1.44 | |||
| Communist Party of Denmark | 174 | 0.65 | -0.28 | |||
| Justice Party of Denmark | 117 | 0.43 | -0.33 | |||
| Thode Karlsen | 2 | 0.01 | New | |||
| Total | 26,952 | |||||
| Source[30] | ||||||
| Parties | Vote | |||||
|---|---|---|---|---|---|---|
| Votes | % | + / - | ||||
| Conservatives | 12,905 | 48.99 | +1.07 | |||
| Social Democrats | 6,284 | 23.85 | -1.78 | |||
| Venstre | 3,073 | 11.66 | +2.29 | |||
| Social Liberals | 1,201 | 4.56 | -0.32 | |||
| Green Left | 1,110 | 4.21 | -0.46 | |||
| Independent Party | 1,018 | 3.86 | -1.41 | |||
| Communist Party of Denmark | 246 | 0.93 | +0.13 | |||
| Justice Party of Denmark | 199 | 0.76 | -0.70 | |||
| Danish Unity | 188 | 0.71 | New | |||
| Peace Politics People's Party | 115 | 0.44 | New | |||
| Elin Høgsbro Appel | 5 | 0.02 | New | |||
| Total | 26,344 | |||||
| Source[31] | ||||||
| Parties | Vote | |||||
|---|---|---|---|---|---|---|
| Votes | % | + / - | ||||
| Conservatives | 11,810 | 47.92 | +2.65 | |||
| Social Democrats | 6,318 | 25.63 | +1.87 | |||
| Venstre | 2,310 | 9.37 | -5.34 | |||
| Independent Party | 1,299 | 5.27 | +2.88 | |||
| Social Liberals | 1,203 | 4.88 | -1.90 | |||
| Green Left | 1,151 | 4.67 | New | |||
| Justice Party of Denmark | 360 | 1.46 | -3.54 | |||
| Communist Party of Denmark | 196 | 0.80 | -1.28 | |||
| Total | 24,647 | |||||
| Source[32] | ||||||
General elections in the 1950s
| Parties | Vote | |||||
|---|---|---|---|---|---|---|
| Votes | % | + / - | ||||
| Conservatives | 10,746 | 45.27 | -1.53 | |||
| Social Democrats | 5,641 | 23.76 | -0.78 | |||
| Venstre | 3,491 | 14.71 | +3.47 | |||
| Social Liberals | 1,610 | 6.78 | -0.11 | |||
| Justice Party of Denmark | 1,188 | 5.00 | +1.27 | |||
| Independent Party | 567 | 2.39 | -0.99 | |||
| Communist Party of Denmark | 494 | 2.08 | -1.34 | |||
| Total | 23,737 | |||||
| Source[33] | ||||||
September 1953 Danish Folketing election
| Parties | Vote | |||||
|---|---|---|---|---|---|---|
| Votes | % | + / - | ||||
| Conservatives | 10,168 | 46.80 | -1.32 | |||
| Social Democrats | 5,331 | 24.54 | -0.30 | |||
| Venstre | 2,443 | 11.24 | +3.50 | |||
| Social Liberals | 1,496 | 6.89 | -1.04 | |||
| Justice Party of Denmark | 811 | 3.73 | -2.72 | |||
| Communist Party of Denmark | 743 | 3.42 | -0.18 | |||
| Independent Party | 735 | 3.38 | New | |||
| Total | 21,727 | |||||
| Source[34] | ||||||
April 1953 Danish Folketing election
| Parties | Vote | |||||
|---|---|---|---|---|---|---|
| Votes | % | + / - | ||||
| Conservatives | 10,038 | 48.12 | +1.81 | |||
| Social Democrats | 5,182 | 24.84 | -1.35 | |||
| Social Liberals | 1,654 | 7.93 | +0.44 | |||
| Venstre | 1,615 | 7.74 | +2.37 | |||
| Justice Party of Denmark | 1,345 | 6.45 | -4.44 | |||
| Communist Party of Denmark | 751 | 3.60 | -0.14 | |||
| Danish Unity | 277 | 1.33 | New | |||
| Total | 20,862 | |||||
| Source[35] | ||||||
1950 Danish Folketing election
| Parties | Vote | |||||
|---|---|---|---|---|---|---|
| Votes | % | + / - | ||||
| Conservatives | 9,246 | 46.31 | +13.57 | |||
| Social Democrats | 5,230 | 26.19 | +4.46 | |||
| Justice Party of Denmark | 2,175 | 10.89 | +3.41 | |||
| Social Liberals | 1,496 | 7.49 | +0.42 | |||
| Venstre | 1,072 | 5.37 | +5.37 | |||
| Communist Party of Denmark | 747 | 3.74 | -0.60 | |||
| Total | 19,966 | |||||
| Source[36] | ||||||
General elections in the 1940s
1947 Danish Folketing election
| Parties | Vote | |||||
|---|---|---|---|---|---|---|
| Votes | % | + / - | ||||
| Conservatives | 14,923 | 32.74 | -17.04 | |||
| Venstre | 10,973 | 24.08 | +15.80 | |||
| Social Democrats | 9,906 | 21.73 | +4.97 | |||
| Justice Party of Denmark | 3,411 | 7.48 | +5.43 | |||
| Social Liberals | 3,221 | 7.07 | +0.94 | |||
| Communist Party of Denmark | 1,979 | 4.34 | -4.74 | |||
| Danish Unity | 1,165 | 2.56 | -5.33 | |||
| Total | 45,578 | |||||
| Source[37] | ||||||
1945 Danish Folketing election
| Parties | Vote | |||||
|---|---|---|---|---|---|---|
| Votes | % | + / - | ||||
| Conservatives | 22,553 | 49.78 | -4.99 | |||
| Social Democrats | 7,594 | 16.76 | -8.82 | |||
| Communist Party of Denmark | 4,113 | 9.08 | New | |||
| Venstre | 3,753 | 8.28 | +6.05 | |||
| Danish Unity | 3,576 | 7.89 | +1.57 | |||
| Social Liberals | 2,776 | 6.13 | -0.33 | |||
| Justice Party of Denmark | 931 | 2.05 | +0.23 | |||
| Edward Hjalmar Larsen | 13 | 0.03 | New | |||
| Total | 45,309 | |||||
| Source[38] | ||||||
1943 Danish Folketing election
| Parties | Vote | |||||
|---|---|---|---|---|---|---|
| Votes | % | + / - | ||||
| Conservatives | 24,560 | 54.77 | +1.34 | |||
| Social Democrats | 11,472 | 25.58 | -1.14 | |||
| Social Liberals | 2,896 | 6.46 | -2.53 | |||
| Danish Unity | 2,833 | 6.32 | +5.10 | |||
| National Socialist Workers' Party of Denmark | 1,264 | 2.82 | +1.21 | |||
| Venstre | 1,001 | 2.23 | +0.13 | |||
| Justice Party of Denmark | 816 | 1.82 | -0.20 | |||
| Chr. Orla Nielsen | 4 | 0.01 | New | |||
| Total | 44,846 | |||||
| Source[39] | ||||||
General elections in the 1930s
1939 Danish Folketing election
| Parties | Vote | |||||
|---|---|---|---|---|---|---|
| Votes | % | + / - | ||||
| Conservatives | 18,579 | 53.43 | +2.09 | |||
| Social Democrats | 9,290 | 26.72 | -6.67 | |||
| Social Liberals | 3,126 | 8.99 | -0.13 | |||
| National Cooperation | 964 | 2.77 | New | |||
| Venstre | 731 | 2.10 | +0.82 | |||
| Justice Party of Denmark | 704 | 2.02 | -0.94 | |||
| National Socialist Workers' Party of Denmark | 560 | 1.61 | +0.67 | |||
| Danish Unity | 425 | 1.22 | New | |||
| Communist Party of Denmark | 369 | 1.06 | +0.17 | |||
| Farmers' Party | 24 | 0.07 | -0.01 | |||
| Total | 34,772 | |||||
| Source[40] | ||||||
1935 Danish Folketing election
| Parties | Vote | |||||
|---|---|---|---|---|---|---|
| Votes | % | + / - | ||||
| Conservatives | 14,619 | 51.34 | +1.36 | |||
| Social Democrats | 9,508 | 33.39 | +0.32 | |||
| Social Liberals | 2,596 | 9.12 | +1.30 | |||
| Justice Party of Denmark | 844 | 2.96 | -1.26 | |||
| Venstre | 365 | 1.28 | -2.78 | |||
| National Socialist Workers' Party of Denmark | 269 | 0.94 | New | |||
| Communist Party of Denmark | 253 | 0.89 | +0.10 | |||
| Independent People's Party | 23 | 0.08 | New | |||
| Total | 28,477 | |||||
| Source[41] | ||||||
1932 Danish Folketing election
| Parties | Vote | |||||
|---|---|---|---|---|---|---|
| Votes | % | + / - | ||||
| Conservatives | 11,247 | 49.98 | +0.99 | |||
| Social Democrats | 7,441 | 33.07 | +2.24 | |||
| Social Liberals | 1,760 | 7.82 | -1.15 | |||
| Justice Party of Denmark | 949 | 4.22 | +1.10 | |||
| Venstre | 914 | 4.06 | -3.90 | |||
| Communist Party of Denmark | 177 | 0.79 | +0.66 | |||
| W. Colding | 14 | 0.06 | New | |||
| Christian Sørensen | 2 | 0.01 | New | |||
| Total | 22,504 | |||||
| Source[42] | ||||||
General elections in the 1920s
1929 Danish Folketing election
| Parties | Vote | |||||
|---|---|---|---|---|---|---|
| Votes | % | + / - | ||||
| Conservatives | 8,811 | 48.99 | -8.74 | |||
| Social Democrats | 5,545 | 30.83 | +3.89 | |||
| Social Liberals | 1,614 | 8.97 | +0.20 | |||
| Venstre | 1,431 | 7.96 | +2.94 | |||
| Justice Party of Denmark | 561 | 3.12 | +1.73 | |||
| Communist Party of Denmark | 24 | 0.13 | -0.01 | |||
| Total | 17,986 | |||||
| Source[43] | ||||||
1926 Danish Folketing election
| Parties | Vote | |||||
|---|---|---|---|---|---|---|
| Votes | % | + / - | ||||
| Conservatives | 9,450 | 57.73 | +2.04 | |||
| Social Democrats | 4,410 | 26.94 | -0.87 | |||
| Social Liberals | 1,436 | 8.77 | -1.35 | |||
| Venstre | 822 | 5.02 | +0.64 | |||
| Justice Party of Denmark | 227 | 1.39 | -0.26 | |||
| Communist Party of Denmark | 23 | 0.14 | -0.17 | |||
| Total | 16,368 | |||||
| Source[44] | ||||||
1924 Danish Folketing election
| Parties | Vote | |||||
|---|---|---|---|---|---|---|
| Votes | % | + / - | ||||
| Conservatives | 8,354 | 55.69 | +1.43 | |||
| Social Democrats | 4,172 | 27.81 | +3.36 | |||
| Social Liberals | 1,518 | 10.12 | +1.63 | |||
| Venstre | 657 | 4.38 | -2.98 | |||
| Justice Party of Denmark | 247 | 1.65 | New | |||
| Communist Party of Denmark | 46 | 0.31 | New | |||
| Farmer Party | 6 | 0.04 | New | |||
| Total | 15,000 | |||||
| Source[45] | ||||||
September 1920 Danish Folketing election
| Parties | Vote | |||||
|---|---|---|---|---|---|---|
| Votes | % | + / - | ||||
| Conservatives | 7,093 | 54.26 | -2.90 | |||
| Social Democrats | 3,197 | 24.45 | +3.24 | |||
| Social Liberals | 1,110 | 8.49 | +1.68 | |||
| Venstre | 962 | 7.36 | -0.28 | |||
| Industry Party | 697 | 5.33 | -1.78 | |||
| Danish Left Socialist Party | 14 | 0.11 | New | |||
| Total | 13,073 | |||||
| Source[46] | ||||||
July 1920 Danish Folketing election
| Parties | Vote | |||||
|---|---|---|---|---|---|---|
| Votes | % | + / - | ||||
| Conservatives | 6,221 | 57.16 | +1.58 | |||
| Social Democrats | 2,308 | 21.21 | +1.89 | |||
| Venstre | 831 | 7.64 | +1.25 | |||
| Industry Party | 774 | 7.11 | +0.70 | |||
| Social Liberals | 741 | 6.81 | -2.08 | |||
| A. Sterregaard | 8 | 0.07 | New | |||
| Total | 10,883 | |||||
| Source[47] | ||||||
April 1920 Danish Folketing election
| Parties | Vote | |||||
|---|---|---|---|---|---|---|
| Votes | % | |||||
| Conservatives | 6,971 | 55.58 | ||||
| Social Democrats | 2,423 | 19.32 | ||||
| Social Liberals | 1,115 | 8.89 | ||||
| Industry Party | 804 | 6.41 | ||||
| Venstre | 802 | 6.39 | ||||
| Centrum | 414 | 3.30 | ||||
| Daniel Nielsen | 14 | 0.11 | ||||
| Total | 12,543 | |||||
| Source[48] | ||||||
European Parliament elections results
2019 European Parliament election in Denmark
| Parties | Vote | |||||
|---|---|---|---|---|---|---|
| Votes | % | + / - | ||||
| Venstre | 10,390 | 26.61 | +7.18 | |||
| Conservatives | 6,856 | 17.56 | -0.37 | |||
| Social Liberals | 6,410 | 16.42 | +4.11 | |||
| Green Left | 4,439 | 11.37 | +1.64 | |||
| Social Democrats | 4,133 | 10.59 | -2.60 | |||
| Danish People's Party | 2,138 | 5.48 | -10.87 | |||
| Liberal Alliance | 1,340 | 3.43 | -2.59 | |||
| Red–Green Alliance | 1,311 | 3.36 | New | |||
| The Alternative | 1,222 | 3.13 | New | |||
| People's Movement against the EU | 801 | 2.05 | -2.99 | |||
| Total | 39,040 | |||||
| Source[49] | ||||||
2014 European Parliament election in Denmark
| Parties | Vote | |||||
|---|---|---|---|---|---|---|
| Votes | % | + / - | ||||
| Venstre | 6,502 | 19.43 | -6.23 | |||
| Conservatives | 5,998 | 17.93 | -2.68 | |||
| Danish People's Party | 5,470 | 16.35 | +5.42 | |||
| Social Democrats | 4,415 | 13.19 | +0.02 | |||
| Social Liberals | 4,119 | 12.31 | +4.21 | |||
| Green Left | 3,257 | 9.73 | -3.23 | |||
| Liberal Alliance | 2,015 | 6.02 | +4.91 | |||
| People's Movement against the EU | 1,685 | 5.04 | -0.50 | |||
| Total | 33,461 | |||||
| Source[50] | ||||||
2009 European Parliament election in Denmark
| Parties | Vote | |||||
|---|---|---|---|---|---|---|
| Votes | % | + / - | ||||
| Venstre | 8,602 | 25.66 | +6.05 | |||
| Conservatives | 6,910 | 20.61 | -3.50 | |||
| Social Democrats | 4,415 | 13.17 | -7.09 | |||
| Green Left | 4,344 | 12.96 | +5.28 | |||
| Danish People's Party | 3,666 | 10.93 | +5.06 | |||
| Social Liberals | 2,715 | 8.10 | -2.79 | |||
| People's Movement against the EU | 1,858 | 5.54 | +0.86 | |||
| June Movement | 643 | 1.92 | -4.42 | |||
| Liberal Alliance | 373 | 1.11 | New | |||
| Total | 33,526 | |||||
| Source[51] | ||||||
2004 European Parliament election in Denmark
| Parties | Vote | |||||
|---|---|---|---|---|---|---|
| Votes | % | + / - | ||||
| Conservatives | 3,424 | 24.11 | +6.80 | |||
| Social Democrats | 2,877 | 20.26 | +11.80 | |||
| Venstre | 2,785 | 19.61 | -8.15 | |||
| Social Liberals | 1,547 | 10.89 | -0.44 | |||
| Green Left | 1,090 | 7.68 | +1.26 | |||
| June Movement | 901 | 6.34 | -5.24 | |||
| Danish People's Party | 834 | 5.87 | +0.65 | |||
| People's Movement against the EU | 665 | 4.68 | -1.50 | |||
| Christian Democrats | 78 | 0.55 | -0.79 | |||
| Total | 14,201 | |||||
| Source[52] | ||||||
1999 European Parliament election in Denmark
| Parties | Vote | |||||
|---|---|---|---|---|---|---|
| Votes | % | + / - | ||||
| Venstre | 4,112 | 27.76 | +11.97 | |||
| Conservatives | 2,564 | 17.31 | -18.11 | |||
| June Movement | 1,715 | 11.58 | -0.09 | |||
| Social Liberals | 1,678 | 11.33 | +1.52 | |||
| Social Democrats | 1,253 | 8.46 | +1.72 | |||
| Green Left | 951 | 6.42 | -1.76 | |||
| People's Movement against the EU | 916 | 6.18 | -2.10 | |||
| Danish People's Party | 773 | 5.22 | New | |||
| Centre Democrats | 651 | 4.40 | +2.94 | |||
| Christian Democrats | 198 | 1.34 | +0.76 | |||
| Progress Party | 56 | 0.38 | -1.70 | |||
| Total | 14,811 | |||||
| Source[53] | ||||||
1994 European Parliament election in Denmark
| Parties | Vote | |||||
|---|---|---|---|---|---|---|
| Votes | % | + / - | ||||
| Conservatives | 5,631 | 35.42 | +8.24 | |||
| Venstre | 2,510 | 15.79 | +0.75 | |||
| June Movement | 1,855 | 11.67 | New | |||
| Social Liberals | 1,559 | 9.81 | +6.09 | |||
| People's Movement against the EU | 1,317 | 8.28 | -7.81 | |||
| Green Left | 1,300 | 8.18 | +0.82 | |||
| Social Democrats | 1,071 | 6.74 | -4.26 | |||
| Progress Party | 330 | 2.08 | -1.72 | |||
| Centre Democrats | 232 | 1.46 | -12.51 | |||
| Christian Democrats | 92 | 0.58 | -1.27 | |||
| Total | 15,897 | |||||
| Source[54] | ||||||
1989 European Parliament election in Denmark
| Parties | Vote | |||||
|---|---|---|---|---|---|---|
| Votes | % | + / - | ||||
| Conservatives | 3,835 | 27.18 | -13.05 | |||
| People's Movement against the EU | 2,271 | 16.09 | -3.05 | |||
| Venstre | 2,123 | 15.04 | +9.89 | |||
| Centre Democrats | 1,971 | 13.97 | +4.11 | |||
| Social Democrats | 1,552 | 11.00 | +2.09 | |||
| Green Left | 1,038 | 7.36 | +0.81 | |||
| Progress Party | 536 | 3.80 | +0.17 | |||
| Social Liberals | 525 | 3.72 | +0.20 | |||
| Christian Democrats | 261 | 1.85 | +0.21 | |||
| Total | 14,112 | |||||
| Source[55] | ||||||
1984 European Parliament election in Denmark
| Parties | Vote | |||||
|---|---|---|---|---|---|---|
| Votes | % | |||||
| Conservatives | 6,346 | 40.23 | ||||
| People's Movement against the EU | 3,020 | 19.14 | ||||
| Centre Democrats | 1,555 | 9.86 | ||||
| Social Democrats | 1,406 | 8.91 | ||||
| Green Left | 1,034 | 6.55 | ||||
| Venstre | 812 | 5.15 | ||||
| Progress Party | 573 | 3.63 | ||||
| Social Liberals | 555 | 3.52 | ||||
| Christian Democrats | 259 | 1.64 | ||||
| Left Socialists | 216 | 1.37 | ||||
| Total | 15,776 | |||||
| Source[56] | ||||||
Referendums
2022 Danish European Union opt-out referendum[57]
| Option | Votes | % |
|---|---|---|
| ✓ YES | 29,382 | 80.17 |
| X NO | 7,268 | 19.83 |
2015 Danish European Union opt-out referendum[58]
| Option | Votes | % |
|---|---|---|
| ✓ YES | 25,149 | 65.90 |
| X NO | 13,016 | 34.10 |
2014 Danish Unified Patent Court membership referendum[59]
| Option | Votes | % |
|---|---|---|
| ✓ YES | 24,414 | 75.29 |
| X NO | 8,014 | 24.71 |
2009 Danish Act of Succession referendum[60]
| Option | Votes | % |
|---|---|---|
| ✓ YES | 25,644 | 86.40 |
| X NO | 4,038 | 13.60 |
2000 Danish euro referendum[61]
| Option | Votes | % |
|---|---|---|
| ✓ YES | 13,812 | 62.25 |
| X NO | 8,377 | 37.75 |
1998 Danish Amsterdam Treaty referendum[62]
| Option | Votes | % |
|---|---|---|
| ✓ YES | 13,666 | 68.14 |
| X NO | 6,391 | 31.86 |
1993 Danish Maastricht Treaty referendum[63]
| Option | Votes | % |
|---|---|---|
| ✓ YES | 15,633 | 68.78 |
| X NO | 7,096 | 31.22 |
1992 Danish Maastricht Treaty referendum[64]
| Option | Votes | % |
|---|---|---|
| ✓ YES | 14,125 | 63.97 |
| X NO | 7,954 | 36.03 |
1986 Danish Single European Act referendum[65]
| Option | Votes | % |
|---|---|---|
| ✓ YES | 14,146 | 69.42 |
| X NO | 6,231 | 30.58 |
1972 Danish European Communities membership referendum[66]
| Option | Votes | % |
|---|---|---|
| ✓ YES | 18,580 | 71.28 |
| X NO | 7,487 | 28.72 |
1953 Danish constitutional and electoral age referendum[67]
| Option | Votes | % |
|---|---|---|
| ✓ YES | 9,742 | 64.99 |
| X NO | 5,249 | 35.01 |
| 23 years | 9,820 | 65.45 |
| 21 years | 5,183 | 34.55 |
1939 Danish constitutional referendum[68]
| Option | Votes | % |
|---|---|---|
| ✓ YES | 19,816 | 86.90 |
| X NO | 2,987 | 13.10 |
References
- ↑ "Gentoftekredsen". kmdvalg.dk (in Danish). Retrieved 2023-06-08.
- ↑ "Forslag til Lov om Valg til Rigsdagen". Rigsdagstidende. 1914-15 (første samling): Tillæg C, spalte 1067 ff.
- ↑ "Nye valgkredse fordeler stemmerne anderledes". dr.dk (in Danish). Retrieved 2023-06-08.
- ↑ "Beretning om nye valgkredse som følge af kommunalreformen" (in Danish). Retrieved 2023-06-08.
- ↑ "Det danske valgsystem: Valg til Folketinget". valg.im (in Danish). Retrieved 2023-06-08.
- ↑ "13 Gentofte". dataforsyningen.dk (in Danish). Retrieved 2023-06-08.
- ↑ "Forslag til Lov om Valg til Rigsdagen". Rigsdagstidende. 1914-15 (første samling): Tillæg C, spalte 1067 ff.
- ↑ "Forslag til Lov om Valg til Rigsdagen". Rigsdagstidende. 1947–48: Tillæg C, spalte 1777 ff.
- ↑ "Valgresultater fra tidligere valg:". kmdvalg (in Danish). Retrieved 2023-06-08.
- ↑ "FOLKETINGSVALG TIRSDAG 1. NOVEMBER 2022". valg.im (in Danish). Retrieved 2023-06-27.
- ↑ "FOLKETINGSVALG ONSDAG 5. JUNI 2019". valg.im (in Danish). Retrieved 2023-06-27.
- ↑ "FOLKETINGSVALG TORSDAG 18. JUNI 2015". valg.im (in Danish). Retrieved 2023-06-27.
- ↑ "FOLKETINGSVALG TORSDAG 15. SEPTEMBER 2011". valg.im (in Danish). Retrieved 2023-06-27.
- ↑ "Folketingsvalget den 13. november 2007". valg.im (in Danish). Retrieved 2023-06-27.
- ↑ "valg2005.book" (PDF). valg.im (in Danish). Retrieved 2023-06-27.
- ↑ "BMTABEL" (PDF). valg.im (in Danish). Retrieved 2023-06-27.
- ↑ "VALG98" (PDF). valg.im (in Danish). Retrieved 2023-06-27.
- ↑ "VALG94" (PDF). valg.im (in Danish). Retrieved 2023-06-27.
- ↑ "VALG90" (PDF). valg.im (in Danish). Retrieved 2023-06-27.
- ↑ "Folketingsvalget den 10. maj 1988". valg.im (in Danish). Retrieved 2023-06-27.
- ↑ "Folketingsvalget den 8.september 1987". dst.dk (in Danish). Retrieved 2023-06-27.
- ↑ "Folketingsvalget den 10. januar 1984". dst.dk (in Danish). Retrieved 2023-06-27.
- ↑ "Folketingsvalget den 8. december 1981". dst.dk (in Danish). Retrieved 2023-06-27.
- ↑ "Folketingsvalget den 23. oktober 1979". dst.dk (in Danish). Retrieved 2023-06-27.
- ↑ "Folketingsvalget den 15. februar 1977". dst.dk (in Danish). Retrieved 2023-06-27.
- ↑ "Folketingsvalget den 9. januar 1975". dst.dk (in Danish). Retrieved 2023-06-27.
- ↑ "Folketingsvalget den 4. december 1973". dst.dk (in Danish). Retrieved 2023-06-27.
- ↑ "Folketingsvalget den 21. september 1971 samt folkeafstemningen". dst.dk (in Danish). Retrieved 2023-06-27.
- ↑ "Folketingsvalget den 23. januar 1968". dst.dk (in Danish). Retrieved 2023-06-27.
- ↑ "Folketingsvalget den 22. november 1966". dst.dk (in Danish). Retrieved 2023-06-27.
- ↑ "Folketingsvalget den 22. september 1964". dst.dk (in Danish). Retrieved 2023-06-27.
- ↑ "Folketingsvalget den 15. november 1960". dst.dk (in Danish). Retrieved 2023-06-27.
- ↑ "Folketingsvalget den 14. maj 1957". dst.dk (in Danish). Retrieved 2023-06-27.
- ↑ "Folketingsvalget den 22. september 1953". dst.dk (in Danish). Retrieved 2023-06-27.
- ↑ "Rigsdagsvalgene og folkeafstemningerne i april og maj 1953". dst.dk (in Danish). Retrieved 2023-06-27.
- ↑ "Folketingsvalget den 5. september 1950". dst.dk (in Danish). Retrieved 2023-06-27.
- ↑ "Folketingsvalget den 28. oktober 1947". dst.dk (in Danish). Retrieved 2023-06-27.
- ↑ "Rigsdagsvalgene i oktober og november 1945". dst.dk (in Danish). Retrieved 2023-06-27.
- ↑ "Rigsdagsvalgene i marts og april 1943". dst.dk (in Danish). Retrieved 2023-06-27.
- ↑ "Rigsdagsvalgene og Folkeafstemningen i april og maj 1939". dst.dk (in Danish). Retrieved 2023-06-27.
- ↑ "Folketingsvalget den 22. oktober 1935". dst.dk (in Danish). Retrieved 2023-06-27.
- ↑ "Folketingsvalget den 16. november 1932". dst.dk (in Danish). Retrieved 2023-06-27.
- ↑ "Folketingsvalget den 24. april 1929". dst.dk (in Danish). Retrieved 2023-06-27.
- ↑ "Folketingsvalget den 2. december 1926". dst.dk (in Danish). Retrieved 2023-06-27.
- ↑ "Folketingsvalget den 11. april 1924". dst.dk (in Danish). Retrieved 2023-06-27.
- ↑ "Rigsdagsvalgene september-oktober 1920". dst.dk (in Danish). Retrieved 2023-06-27.
- ↑ "Rigsdagsvalgene juli-august 1920". dst.dk (in Danish). Retrieved 2023-06-27.
- ↑ "Folketingsvalget den 26. april 1920". dst.dk (in Danish). Retrieved 2023-06-27.
- ↑ "EUROPA-PARLAMENTSVALG SØNDAG 26. MAJ 2019". dst.dk (in Danish). Retrieved 2023-07-01.
- ↑ "EUROPA-PARLAMENTSVALG SØNDAG 25. MAJ 2014". dst.dk (in Danish). Retrieved 2023-07-01.
- ↑ "EUROPA-PARLAMENTSVALG SØNDAG 7. JUNI 2009". dst.dk (in Danish). Retrieved 2023-07-01.
- ↑ "EUROPA-PARLAMENTSVALGET DEN 13. JUNI 2004" (PDF). im.dk (in Danish). Retrieved 2023-07-01.
- ↑ "VALGET TIL EUROPA-PARLAMENTET DEN 10. JUNI 1999" (PDF). im.dk (in Danish). Retrieved 2023-07-01.
- ↑ "VALGET TIL EUROPA-PARLAMENTET DEN 9. JUNI 1994" (PDF). im.dk (in Danish). Retrieved 2023-07-01.
- ↑ "Valget til Europa-parlamentet den 15. juni 1989". dst.dk (in Danish). Retrieved 2023-07-01.
- ↑ "Valget til Europa-Parlamentet den 14. juni 1984". dst.dk (in Danish). Retrieved 2023-07-01.
- ↑ "FOLKEAFSTEMNING ONSDAG 1. JUNI 2022". dst.dk (in Danish). Retrieved 2023-07-05.
- ↑ "FOLKEAFSTEMNING TORSDAG 3. DECEMBER 2015". dst.dk (in Danish). Retrieved 2023-07-05.
- ↑ "FOLKEAFSTEMNING SØNDAG 25. MAJ 2014". dst.dk (in Danish). Retrieved 2023-07-05.
- ↑ "FOLKEAFSTEMNING SØNDAG 7. JUNI 2009". dst.dk (in Danish). Retrieved 2023-07-05.
- ↑ "FOLKEAFSTEMNINGEN DEN 28. SEPTEMBER 2000 OM DANMARKS DELTAGELSE I DEN FÆLLES VALUTA" (PDF). valg.im (in Danish). Retrieved 2023-07-05.
- ↑ "FOLKEAFSTEMNINGEN DEN 28. MAJ 1998OM DANMARKS TILTRÆDELSE AF AMSTERDAMTRAKTATEN" (PDF). valg.im (in Danish). Retrieved 2023-07-05.
- ↑ "FOLKEAFSTEMNINGEN DEN 18. MAJ 1993 OM DANMARKS TILTRÆDELSE AF EDINBURGH-AFGØRELSEN OG MAASTRICHT-TRAKTATEN". dst.dk (in Danish). Retrieved 2023-07-05.
- ↑ "Folkeafstemningen den 1. juni 1992 om Danmarks tiltrædelse af traktaten om Den Europæiske Union". dst.dk (in Danish). Retrieved 2023-07-05.
- ↑ "Vejledende folkeafstemning torsdag den 27. februar 1986 om Danmarks tiltrædelse af EF- pakken". dst.dk (in Danish). Retrieved 2023-07-05.
- ↑ "Folkeafstemningen om Danmarks tiltrædelse af De europæiske Fælleskaber 2. oktober 1972". dst.dk (in Danish). Retrieved 2023-07-05.
- ↑ "Publikationsfortegnelse vedrørende Folkeafstemninger". dst.dk (in Danish). Retrieved 2023-07-05.
- ↑ "Publikationsfortegnelse vedrørende Folkeafstemninger". dst.dk (in Danish). Retrieved 2023-07-05.