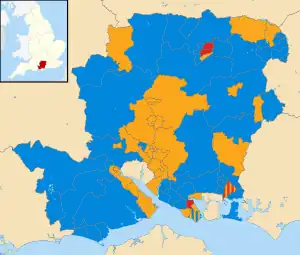
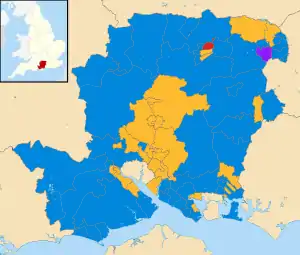
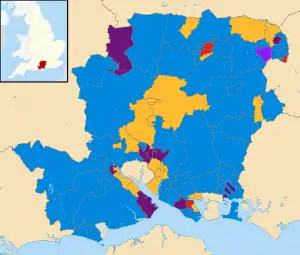
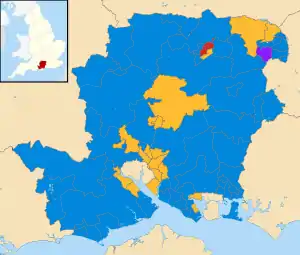
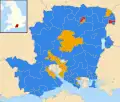
Hampshire County Council in England is elected every four years. Since the boundary changes in 2005, 78 councillors have been elected from 75 wards, with further boundary changes in 2017.[1][2]
Council elections
- 2001 Hampshire County Council election
- 2005 Hampshire County Council election (boundary changes increased the number of seats by 2)[3]
- 2009 Hampshire County Council election
- 2013 Hampshire County Council election
- 2017 Hampshire County Council election (boundary changes)
- 2021 Hampshire County Council election
County result maps
By-election results
1997–2001
| Party | Candidate | Votes | % | ±% | |
|---|---|---|---|---|---|
| Liberal Democrats | 1,674 | 48.7 | +6.0 | ||
| Conservative | 1,628 | 47.3 | +1.8 | ||
| Labour | 138 | 4.0 | -7.8 | ||
| Majority | 46 | 1.4 | |||
| Turnout | 3,440 | 22.0 | |||
| Liberal Democrats gain from Conservative | Swing | ||||
| Party | Candidate | Votes | % | ±% | |
|---|---|---|---|---|---|
| Conservative | 742 | 43.2 | +5.9 | ||
| Labour | 564 | 32.8 | -2.4 | ||
| Liberal Democrats | 347 | 20.2 | -5.2 | ||
| Independent | 64 | 3.7 | +3.7 | ||
| Majority | 178 | 10.4 | |||
| Turnout | 1,717 | 16.5 | |||
| Conservative hold | Swing | ||||
| Party | Candidate | Votes | % | ±% | |
|---|---|---|---|---|---|
| Conservative | 741 | 47.3 | +10.9 | ||
| Liberal Democrats | 554 | 35.4 | +5.5 | ||
| Labour | 270 | 17.3 | -12.8 | ||
| Majority | 187 | 11.9 | |||
| Turnout | 1,565 | 10.6 | |||
| Conservative hold | Swing | ||||
| Party | Candidate | Votes | % | ±% | |
|---|---|---|---|---|---|
| Labour | 1,107 | 51.1 | -3.4 | ||
| Conservative | 617 | 28.5 | +2.6 | ||
| Liberal Democrats | 443 | 20.4 | +1.8 | ||
| Majority | 490 | 22.6 | |||
| Turnout | 2,167 | 20.2 | |||
| Conservative hold | Swing | ||||
| Party | Candidate | Votes | % | ±% | |
|---|---|---|---|---|---|
| Conservative | John Stocks | 1,044 | 63.9 | +28.2 | |
| Liberal Democrats | Helen Alley | 373 | 22.8 | +8.0 | |
| Labour | Peter Cotton | 217 | 13.3 | +6.5 | |
| Majority | 671 | 41.1 | |||
| Turnout | 1,634 | 13.8 | |||
| Conservative gain from Independent | Swing | ||||
2001–2005
| Party | Candidate | Votes | % | ±% | |
|---|---|---|---|---|---|
| Labour | 1,606 | 68.3 | +11.9 | ||
| Conservative | 639 | 27.2 | -6.2 | ||
| Liberal Democrats | 107 | 4.5 | -5.7 | ||
| Majority | 967 | 41.1 | |||
| Turnout | 2,352 | 21.7 | |||
| Labour hold | Swing | ||||
| Party | Candidate | Votes | % | ±% | |
|---|---|---|---|---|---|
| Liberal Democrats | John Shaw | 1,223 | 38.6 | +11.8 | |
| Conservative | Harry Robinson | 1,126 | 35.5 | +4.2 | |
| Labour | Julie Johnson | 824 | 26.0 | -15.9 | |
| Majority | 98 | 3.1 | |||
| Turnout | 3,174 | 28.5 | |||
| Liberal Democrats gain from Labour | Swing | ||||
| Party | Candidate | Votes | % | ±% | |
|---|---|---|---|---|---|
| Liberal Democrats | Lee Dunsdon | 1,796 | 66.9 | +21.0 | |
| Conservative | Alexis McEvoy | 801 | 29.8 | -7.7 | |
| Labour | Alan Goodfellow | 87 | 3.2 | -13.5 | |
| Majority | 995 | 37.1 | |||
| Turnout | 2,684 | 25.0 | |||
| Liberal Democrats hold | Swing | ||||
| Party | Candidate | Votes | % | ±% | |
|---|---|---|---|---|---|
| Liberal Democrats | Ann Buckley | 978 | 56.6 | +36.2 | |
| Labour | 433 | 25.0 | -31.0 | ||
| Conservative | 285 | 16.5 | -7.0 | ||
| Green | 33 | 1.9 | +1.9 | ||
| Majority | 545 | 31.6 | |||
| Turnout | 1,729 | 17.2 | |||
| Liberal Democrats gain from Labour | Swing | ||||
2009–2013
| Party | Candidate | Votes | % | ±% | |
|---|---|---|---|---|---|
| Conservative | Ferris Cowper | 1,588 | 64.4 | ||
| Liberal Democrats | Maureen Comber | 290 | 11.8 | ||
| Labour | John Tough | 258 | 10.5 | ||
| Green | Neville Taylor | 178 | 7.2 | ||
| Justice & Anti-Corruption Party | Don Jerrard | 146 | 5.9 | ||
| Majority | 1,298 | 52.8 | |||
| Turnout | 2,473 | 18.5 | |||
| Conservative hold | Swing | ||||
References
- ↑ "County Council Elections". Hampshire County Council. Archived from the original on 26 July 2009. Retrieved 5 September 2009.
- ↑ "LGBCE | Hampshire County Council | LGBCE Site". www.lgbce.org.uk. Retrieved 14 April 2020.
- ↑ "Local election results: Hampshire". * BBC News Online. Retrieved 5 September 2009.
- ↑ "By-Election November 2000". Hampshire County Council. Archived from the original on 8 August 2007. Retrieved 5 September 2009.
- ↑ "Victory for Lib-Dems". Hampshire Chronicle. 10 February 2003. Retrieved 5 September 2009.
- ↑ "Declaration of result of poll". New Forest District Council. Retrieved 5 September 2009.
- ↑ "Lib Dems enjoy landslide". guardian.co.uk. 3 December 2004. Retrieved 5 September 2009.
- ↑ "2011 By-Election 15/09/2011". Hampshire County Council. Retrieved 16 September 2011.
- Hampshire election results
- By-election results Archived 29 March 2010 at the Wayback Machine
External links
This article is issued from Wikipedia. The text is licensed under Creative Commons - Attribution - Sharealike. Additional terms may apply for the media files.
