| ||||||||||||||||||||||
All 48 seats to Test Valley Borough Council 24 seats needed for a majority | ||||||||||||||||||||||
|---|---|---|---|---|---|---|---|---|---|---|---|---|---|---|---|---|---|---|---|---|---|---|
| ||||||||||||||||||||||
 | ||||||||||||||||||||||
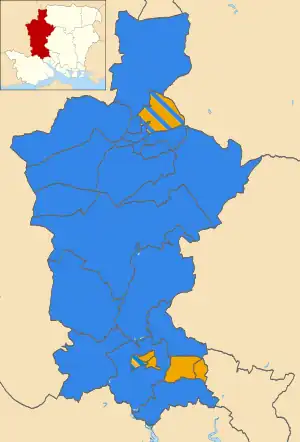
The 2007 Test Valley Borough Council election took place on the 3 May 2007. All 48 seats were up for election. 24 seats were needed for a majority, with the Conservatives increasing their majority by three seats. Both independents lost their seats, one to the Conservatives and one to the Liberal Democrats, who in turn lost a seat to the Conservatives.[1][2]
Results
| Party | Seats | Gains | Losses | Net gain/loss | Seats % | Votes % | Votes | +/− | |
|---|---|---|---|---|---|---|---|---|---|
| Conservative | 33 | 3 | 0 | 68.75 | 54.05 | 18,669 | |||
| Liberal Democrats | 15 | 1 | 2 | 31.25 | 37.07 | 12,804 | |||
| Labour | 0 | 0 | 5.15 | 1,781 | |||||
| UKIP | 0 | 0 | 3.32 | 1,148 | |||||
| Independent | 0 | 0 | 0 | 0.38 | 846 | ||||
| Total | 48 | 34536 | |||||||
Ward results
Abbey
| Party | Candidate | Votes | % | ±% | |
|---|---|---|---|---|---|
| Liberal Democrats | Sally Lamb | 944 | 49.01 | ||
| Conservative | Clive Collier | 862 | 44.75 | ||
| Conservative | Mark Bramley | 782 | |||
| Liberal Democrats | Sandra Rispin | 781 | |||
| Labour | Sandra Smith | 120 | 6.23 | ||
| Majority | |||||
| Turnout | 1,926 | ||||
| Liberal Democrats gain from Independent | Swing | ||||
| Conservative hold | Swing | ||||
Alamein
| Party | Candidate | Votes | % | ±% | |
|---|---|---|---|---|---|
| Conservative | Phil North | 793 | 42.33 | ||
| Liberal Democrats | Len Gates | 784 | 41.85 | ||
| Conservative | Janet Whiteley | 772 | |||
| Liberal Democrats | Robin Hughes | 767 | |||
| Conservative | Karen Hamilton | 733 | |||
| Liberal Democrats | Josephine Msonthi | 689 | |||
| UKIP | Anthony McCabe | 149 | 7.95 | ||
| Labour | Alan Cotter | 147 | 7.84 | ||
| Majority | |||||
| Conservative gain from Liberal Democrats | Swing | ||||
| Liberal Democrats hold | Swing | ||||
| Conservative gain from Liberal Democrats | Swing | ||||
Ampfield and Braishfield
| Party | Candidate | Votes | % | ±% | |
|---|---|---|---|---|---|
| Conservative | Martin Hatley | 755 | 80.57 | ||
| Liberal Democrats | Clive Anderson | 145 | 15.47 | ||
| Labour | David Stevens | 37 | 3.94 | ||
| Majority | 610 | 65.10 | |||
| Conservative hold | Swing | ||||
Amport
| Party | Candidate | Votes | % | ±% | |
|---|---|---|---|---|---|
| Conservative | Tim Southern | Unopposed | |||
| Conservative hold | Swing | ||||
Anna
| Party | Candidate | Votes | % | ±% | |
|---|---|---|---|---|---|
| Conservative | Arthur Peters | 1,085 | 63.82 | ||
| Conservative | Graham Stallard | 1,007 | |||
| Liberal Democrats | Tony Evans | 332 | 19.52 | ||
| Liberal Democrats | Rosalie Sweetman | 304 | |||
| UKIP | Stan Oram | 283 | 16.64 | ||
| Majority | |||||
| Turnout | 1,700 | ||||
| Conservative hold | Swing | ||||
| Conservative hold | Swing | ||||
Blackwater
| Party | Candidate | Votes | % | ±% | |
|---|---|---|---|---|---|
| Conservative | Tony Gentle | 1,396 | 78.51 | ||
| Conservative | Gordon Bailey | 1,333 | |||
| Liberal Democrats | Robert Sims | 382 | 21.48 | ||
| Liberal Democrats | Mike Curtis | 372 | |||
| Majority | |||||
| Turnout | 1,778 | ||||
| Conservative hold | Swing | ||||
| Conservative hold | Swing | ||||
Bourne Valley
| Party | Candidate | Votes | % | ±% | |
|---|---|---|---|---|---|
| Conservative | Peter Giddings | 622 | 81.20 | ||
| Liberal Democrats | Ryan Hughes | 144 | 18.79 | ||
| Majority | |||||
| Turnout | 766 | ||||
| Conservative hold | Swing | ||||
Broughton and Stockbridge
| Party | Candidate | Votes | % | ±% | |
|---|---|---|---|---|---|
| Conservative | Peter Boulton | 1,331 | 75.62 | ||
| Conservative | Daniel Busk | 1,248 | |||
| Liberal Democrats | Robert Sims | 429 | 24.37 | ||
| Liberal Democrats | David Johnson | 396 | |||
| Majority | |||||
| Turnout | 1,760 | ||||
| Conservative hold | Swing | ||||
| Conservative hold | Swing | ||||
Charlton
| Party | Candidate | Votes | % | ±% | |
|---|---|---|---|---|---|
| Conservative | Ian Carr | 487 | 66.98 | ||
| Liberal Democrats | Garry Whittam | 240 | 33.01 | ||
| Majority | |||||
| Turnout | 727 | ||||
| Conservative hold | Swing | ||||
Chilworth, Nursling and Rownhams
| Party | Candidate | Votes | % | ±% | |
|---|---|---|---|---|---|
| Conservative | Nigel Anderdon | 1,225 | 60.58 | ||
| Conservative | Philip Bundy | 1,190 | |||
| Conservative | Alison Finlay | 1,099 | |||
| Liberal Democrats | Brian Richards | 615 | 30.41 | ||
| Liberal Democrats | Sandra Cosier | 586 | |||
| Liberal Democrats | Max Buckmaster | 544 | |||
| Labour | Albert Astbury | 182 | 9.00 | ||
| Majority | |||||
| Conservative hold | Swing | ||||
| Conservative hold | Swing | ||||
| Conservative hold | Swing | ||||
Cupernham
| Party | Candidate | Votes | % | ±% | |
|---|---|---|---|---|---|
| Liberal Democrats | Dorothy Baverstock | 1,331 | 60.17 | ||
| Liberal Democrats | Alan Marsh | 881 | 39.82 | ||
| Conservative | John Ray | 745 | 44.34 | ||
| Conservative | Iain Bell | 705 | |||
| Majority | |||||
| Turnout | 1,680 | ||||
| Liberal Democrats hold | Swing | ||||
| Liberal Democrats hold | Swing | ||||
Dun Valley
| Party | Candidate | Votes | % | ±% | |
|---|---|---|---|---|---|
| Conservative | Neville Whiteley | 588 | 70.92 | ||
| Liberal Democrats | Judith Houghton | 241 | 29.07 | ||
| Majority | |||||
| Turnout | 347 | 41.85 | |||
| Conservative hold | Swing | ||||
Harewood
| Party | Candidate | Votes | % | ±% | |
|---|---|---|---|---|---|
| Conservative | Jim Neal | Unopposed | |||
| Conservative hold | Swing | ||||
Harroway
| Party | Candidate | Votes | % | ±% | |
|---|---|---|---|---|---|
| Conservative | Brian Page | 1,049 | 50.65 | ||
| Conservative | Jan Lovell | 1,010 | |||
| Conservative | Carl Borg-Neal | 984 | |||
| Liberal Democrats | Alan Sweetman | 413 | 19.94 | ||
| Liberal Democrats | Peter Wilson | 395 | |||
| Labour | Sarah Evans | 358 | 17.28 | ||
| Liberal Democrats | Ed Treadwell | 324 | |||
| UKIP | Emily Blatchford | 251 | 12.11 | ||
| UKIP | Derek Rumsey | ||||
| Majority | |||||
| Conservative hold | Swing | ||||
| Conservative hold | Swing | ||||
| Conservative hold | Swing | ||||
Kings Somborne and Michelmersh
| Party | Candidate | Votes | % | ±% | |
|---|---|---|---|---|---|
| Conservative | Tony Ward | Unopposed | |||
| Conservative gain from Independent | Swing | ||||
Millway
| Party | Candidate | Votes | % | ±% | |
|---|---|---|---|---|---|
| Conservative | Zilliah Brooks | 1,160 | 57.34 | ||
| Conservative | Sandra Hawke | 1,147 | |||
| Conservative | David Drew | 1,129 | |||
| Liberal Democrats | Alan Sweetman | 647 | 31.98 | ||
| Liberal Democrats | Margaret Henstock | 604 | |||
| Liberal Democrats | Maureen Treadwell | 566 | |||
| Labour | John Newland | 216 | 10.67 | ||
| Majority | 513 | 25.35 | |||
| Conservative hold | Swing | ||||
| Conservative hold | Swing | ||||
| Conservative hold | Swing | ||||
North Baddesley
| Party | Candidate | Votes | % | ±% | |
|---|---|---|---|---|---|
| Liberal Democrats | Stephen Cosier | 1,466 | 61.51 | ||
| Liberal Democrats | Celia Dowden | 1,304 | |||
| Liberal Democrats | Ann Tupper | 1,221 | |||
| Conservative | Robin Oliver | 809 | 33.94 | ||
| Conservative | Mike Draper | 638 | |||
| Conservative | Andrew Gibson | 637 | |||
| Labour | David Moran | 108 | 4.53 | ||
| Labour | Khalid Farooq | 95 | |||
| Majority | 657 | 27.57 | |||
| Liberal Democrats hold | Swing | ||||
| Liberal Democrats hold | Swing | ||||
| Liberal Democrats hold | Swing | ||||
Over Wallop
| Party | Candidate | Votes | % | ±% | |
|---|---|---|---|---|---|
| Conservative | Tony Hope | 329 | 63.14 | ||
| Liberal Democrats | Jane Fisk | 192 | 36.85 | ||
| Majority | 137 | 26.29 | |||
| Turnout | 521 | ||||
| Conservative hold | Swing | ||||
Penton Bellinger
| Party | Candidate | Votes | % | ±% | |
|---|---|---|---|---|---|
| Conservative | Phil Lashbrook | 1,034 | 75.69 | ||
| Conservative | Ellie Charnley | 1,013 | |||
| Liberal Democrats | Lance Mitchell | 332 | 24.30 | ||
| Liberal Democrats | Kevin O'Leary | 238 | |||
| Majority | 702 | 51.39 | |||
| Turnout | 1,366 | ||||
| Conservative hold | Swing | ||||
| Conservative hold | Swing | ||||
Romsey Extra
| Party | Candidate | Votes | % | ±% | |
|---|---|---|---|---|---|
| Conservative | Caroline Nokes | 638 | 52.16 | ||
| Conservative | Ian Hibberd | 571 | |||
| Liberal Democrats | Karen Dunleavey | 543 | 44.39 | ||
| Liberal Democrats | John Burgess | 304 | 515 | ||
| Labour | Ian Paxton | 42 | 3.43 | ||
| Majority | 95 | 7.76 | |||
| Turnout | 1,223 | ||||
| Conservative hold | Swing | ||||
| Conservative hold | Swing | ||||
St Mary's
| Party | Candidate | Votes | % | ±% | |
|---|---|---|---|---|---|
| Liberal Democrats | Rod Bailey | 840 | 41.35 | ||
| Liberal Democrats | Donald Macdonald | 753 | |||
| Liberal Democrats | Michael McGarry | 719 | |||
| Conservative | Jan Budzynski | 699 | 34.41 | ||
| Conservative | Pam Whitehouse | 666 | |||
| Conservative | Peter Mather | 648 | |||
| Labour | Michael Mumford | 270 | 13.29 | ||
| UKIP | Tim Rolt | 222 | 10.93 | ||
| Majority | 141 | 6.94 | |||
| Liberal Democrats hold | Swing | ||||
| Liberal Democrats hold | Swing | ||||
| Liberal Democrats hold | Swing | ||||
Tadburn
| Party | Candidate | Votes | % | ±% | |
|---|---|---|---|---|---|
| Liberal Democrats | Mark Cooper | 1,050 | 51.44 | ||
| Liberal Democrats | Sally Leach | 942 | |||
| Conservative | Jill Gethin | 890 | 43.60 | ||
| Conservative | Ian Richards | 852 | |||
| Labour | Carolyn Nixson | 101 | 4.94 | ||
| Majority | 160 | 7.83 | |||
| Turnout | 2,041 | ||||
| Liberal Democrats hold | Swing | ||||
| Liberal Democrats hold | Swing | ||||
Valley Park
| Party | Candidate | Votes | % | ±% | |
|---|---|---|---|---|---|
| Liberal Democrats | Alan Dowden | 1,401 | 59.46 | ||
| Liberal Democrats | Andrea Dyde | 1,293 | |||
| Liberal Democrats | Louise Guy | 1,268 | |||
| Conservative | John Barton | 955 | 40.53 | ||
| Conservative | Roger Curtis | 927 | |||
| Conservative | James Jaggers | 896 | |||
| Majority | 446 | 18.93 | |||
| Liberal Democrats hold | Swing | ||||
| Liberal Democrats hold | Swing | ||||
| Liberal Democrats hold | Swing | ||||
Winton
| Party | Candidate | Votes | % | ±% | |
|---|---|---|---|---|---|
| Conservative | Marion Kerley | 1,217 | 48.23 | ||
| Conservative | Chris Lynn | 1,188 | |||
| Conservative | Pam Mutton | 1,105 | |||
| Liberal Democrats | David Metcalf | 729 | 28.89 | ||
| Liberal Democrats | Janet Evans | 681 | |||
| Liberal Democrats | Vincent McGarry | 583 | |||
| UKIP | Bill McCabe | 243 | 9.63 | ||
| Labour | Bronwen McCoy | 200 | 7.92 | ||
| Independent | John Smith | 134 | 5.31 | ||
| Majority | 488 | 19.34 | |||
| Conservative hold | Swing | ||||
| Conservative hold | Swing | ||||
| Conservative hold | Swing | ||||
References
- ↑ "Local Elections Archive Project - 2007 - Test Valley". www.andrewteale.me.uk. Retrieved 10 January 2021.
- ↑ "Borough". Test Valley Borough Council. Retrieved 10 January 2021.
This article is issued from Wikipedia. The text is licensed under Creative Commons - Attribution - Sharealike. Additional terms may apply for the media files.