| Harlow | |
|---|---|
| County constituency for the House of Commons | |
 Boundary of Harlow in Essex | |
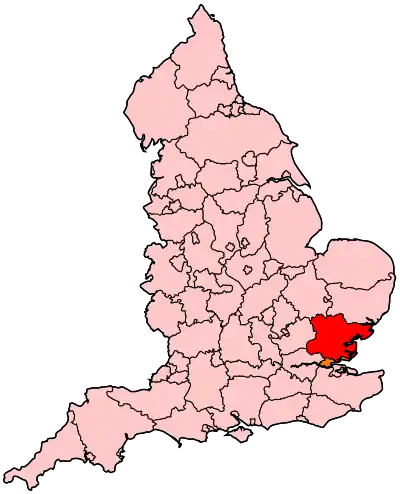 Location of Essex within England | |
| County | Essex |
| Electorate | 67,700 (December 2010)[1] |
| Major settlements | Harlow, Roydon |
| Current constituency | |
| Created | 1974 |
| Member of Parliament | Robert Halfon (Conservative) |
| Seats | One |
| Created from | Epping |
Harlow is a constituency[n 1] represented in the House of Commons of the UK Parliament since 2010 by Robert Halfon, a Conservative.[n 2]
Constituency profile
The seat has been a bellwether since the result in 1983. Included are above county-average levels of social housing,[2] underemployment and unemployment as at the 2001 census and the associated 2000 Index of Multiple Deprivation;[3] however, the new town has brought growth sustained in part by more commuting, with an increasingly-used and separate Mill station in the London Commuter Belt, and has seen a 9.2% increase in the number of apartments to 2011, which brings the proportion of the housing market made up by flats and apartments to 23.8%.[2]
History
This seat was created for the February 1974 general election from the abolished seat of Epping, and has been subject only to minor changes since.
Boundaries and boundary changes
1974–1983
- The Urban District of Harlow; and
- The Rural District of Epping and Ongar parishes of Magdalen Laver, Matching, Nazeing, North Weald Bassett, Roydon, and Sheering.[4]
1983–1997
- The District of Harlow; and
- The District of Epping Forest wards of Nazeing, North Weald Bassett, Roydon, and Sheering.[5]
Minor loss to Brentwood and Ongar.
1997–2010
- The District of Harlow; and
- The District of Epping Forest wards of Nazeing, Roydon, and Sheering.[6]
North Weald Bassett transferred to Epping Forest.
2010–present
- The District of Harlow; and
- The District of Epping Forest wards of Hastingwood, Matching and Sheering Village, Lower Nazeing, Lower Sheering, and Roydon.[7]
Marginal changes due to redistribution of local authority wards.
Proposed
Further to the 2023 Periodic Review of Westminster constituencies, enacted by the Parliamentary Constituencies Order 2023, the composition of the constituency from the next general election, due by January 2025, will be expanded northwards to meet the electorate size requirements, with the transfer in from Saffron Walden of the two District of Uttlesford wards of Broad Oak & the Hallingburys, and Hatfield Heath.[8]
Members of Parliament
| Election | Member[9] | Party | |
|---|---|---|---|
| Feb 1974 | Stan Newens | Labour Co-operative | |
| 1983 | Jerry Hayes | Conservative | |
| 1997 | Bill Rammell | Labour | |
| 2010 | Robert Halfon | Conservative | |
Elections
Elections in the 2020s
| Party | Candidate | Votes | % | ±% | |
|---|---|---|---|---|---|
| Conservative | Robert Halfon[10] | ||||
| Labour | Chris Vince[11] | ||||
| Reform UK | Malcolm Rider Featherstone[12] | ||||
| Majority | |||||
| Turnout | |||||
Elections in the 2010s
| Party | Candidate | Votes | % | ±% | |
|---|---|---|---|---|---|
| Conservative | Robert Halfon | 27,510 | 63.5 | +9.5 | |
| Labour | Laura McAlpine | 13,447 | 31.0 | −7.3 | |
| Liberal Democrats | Charlotte Cane | 2,397 | 5.5 | +3.3 | |
| Majority | 14,063 | 32.5 | +16.8 | ||
| Turnout | 43,354 | 63.7 | −2.5 | ||
| Conservative hold | Swing | +8.4 | |||
| Party | Candidate | Votes | % | ±% | |
|---|---|---|---|---|---|
| Conservative | Robert Halfon | 24,230 | 54.0 | +5.1 | |
| Labour | Phil Waite | 17,199 | 38.3 | +8.3 | |
| UKIP | Mark Gough | 1,787 | 4.0 | −12.3 | |
| Liberal Democrats | Geoffrey Seef | 970 | 2.2 | +0.2 | |
| Green | Hannah Clare | 660 | 1.5 | −0.7 | |
| Majority | 7,031 | 15.7 | −3.2 | ||
| Turnout | 44,846 | 66.2 | +1.1 | ||
| Conservative hold | Swing | −1.6 | |||
| Party | Candidate | Votes | % | ±% | |
|---|---|---|---|---|---|
| Conservative | Robert Halfon | 21,623 | 48.9 | +4.0 | |
| Labour | Suzy Stride | 13,273 | 30.0 | −3.7 | |
| UKIP | Sam Stopplecamp | 7,208 | 16.3 | +12.7 | |
| Green | Murray Sackwild | 954 | 2.2 | New | |
| Liberal Democrats | Geoffrey Seeff | 904 | 2.0 | −11.7 | |
| TUSC | David Brown | 174 | 0.4 | New | |
| English Democrat | Eddy Butler | 115 | 0.3 | New | |
| Majority | 8,350 | 18.9 | +7.7 | ||
| Turnout | 44,251 | 65.1 | ±0.0 | ||
| Conservative hold | Swing | +3.9 | |||
| Party | Candidate | Votes | % | ±% | |
|---|---|---|---|---|---|
| Conservative | Robert Halfon | 19,691 | 44.9 | +4.1 | |
| Labour | Bill Rammell | 14,766 | 33.7 | −7.7 | |
| Liberal Democrats | David White | 5,990 | 13.7 | +0.7 | |
| BNP | Eddy Butler | 1,739 | 4.0 | New | |
| UKIP | John Croft | 1,591 | 3.6 | +1.1 | |
| Christian | Oluyemi Adeeko | 101 | 0.2 | New | |
| Majority | 4,925 | 11.2 | N/A | ||
| Turnout | 43,878 | 65.1 | +2.7 | ||
| Conservative gain from Labour | Swing | +5.9 | |||
Elections in the 2000s
| Party | Candidate | Votes | % | ±% | |
|---|---|---|---|---|---|
| Labour | Bill Rammell | 16,453 | 41.4 | −6.4 | |
| Conservative | Robert Halfon | 16,356 | 41.2 | +6.4 | |
| Liberal Democrats | Lorna Spenceley | 5,002 | 12.6 | −0.8 | |
| UKIP | John Felgate | 981 | 2.5 | −0.5 | |
| Veritas | Anthony Bennett | 941 | 2.4 | New | |
| Majority | 97 | 0.2 | -12.8 | ||
| Turnout | 39,733 | 62.6 | +2.9 | ||
| Labour hold | Swing | −6.4 | |||
| Party | Candidate | Votes | % | ±% | |
|---|---|---|---|---|---|
| Labour | Bill Rammell | 19,169 | 47.8 | −6.3 | |
| Conservative | Robert Halfon | 13,941 | 34.8 | +2.7 | |
| Liberal Democrats | Lorna Spenceley | 5,381 | 13.4 | +3.9 | |
| UKIP | Tony Bennett | 1,223 | 3.0 | +2.3 | |
| Socialist Alliance | John Hobbs | 401 | 1.0 | New | |
| Majority | 5,228 | 13.0 | -9.0 | ||
| Turnout | 40,115 | 59.7 | −14.6 | ||
| Labour hold | Swing | −4.5 | |||
Elections in the 1990s
| Party | Candidate | Votes | % | ±% | |
|---|---|---|---|---|---|
| Labour | Bill Rammell | 25,861 | 54.1 | +12.3 | |
| Conservative | Jerry Hayes | 15,347 | 32.1 | −14.9 | |
| Liberal Democrats | Lorna Spenceley | 4,523 | 9.5 | −1.8 | |
| Referendum | Mark Wells | 1,422 | 3.0 | New | |
| UKIP | Gerard Batten | 340 | 0.7 | New | |
| BNP | John Bowles | 319 | 0.7 | New | |
| Majority | 10,514 | 22.0 | N/A | ||
| Turnout | 47,812 | 74.3 | -8.3 | ||
| Labour gain from Conservative | Swing | +13.6 | |||
| Party | Candidate | Votes | % | ±% | |
|---|---|---|---|---|---|
| Conservative | Jerry Hayes | 26,608 | 47.0 | −0.2 | |
| Labour | Bill Rammell | 23,668 | 41.8 | +5.2 | |
| Liberal Democrats | Lorna Spenceley | 6,375 | 11.3 | −4.9 | |
| Majority | 2,940 | 5.2 | -5.5 | ||
| Turnout | 56,651 | 82.6 | +8.5 | ||
| Conservative hold | Swing | −2.7 | |||
Elections in the 1980s
| Party | Candidate | Votes | % | ±% | |
|---|---|---|---|---|---|
| Conservative | Jerry Hayes | 26,017 | 47.2 | +6.1 | |
| Labour Co-op | Stanley Newens | 20,140 | 36.6 | +2.4 | |
| SDP (Alliance) | Monica Eden-Green | 8,915 | 16.2 | −8.0 | |
| Majority | 5,877 | 10.7 | +3.8 | ||
| Turnout | 55,072 | 74.1 | −2.4 | ||
| Conservative hold | Swing | +1.9 | |||
| Party | Candidate | Votes | % | ±% | |
|---|---|---|---|---|---|
| Conservative | Jerry Hayes | 21,924 | 41.1 | +1.0 | |
| Labour Co-op | Stanley Newens | 18,250 | 34.2 | −8.5 | |
| Liberal (Alliance) | John Bastick | 12,891 | 24.2 | +8.6 | |
| Independent | John Ward | 256 | 0.5 | New | |
| Majority | 3,674 | 6.9 | N/A | ||
| Turnout | 53,321 | 76.5 | −2.2 | ||
| Conservative gain from Labour Co-op | Swing | +4.8 | |||
Elections in the 1970s
| Party | Candidate | Votes | % | ±% | |
|---|---|---|---|---|---|
| Labour Co-op | Stanley Newens | 22,698 | 42.7 | −10.0 | |
| Conservative | John Powley | 21,306 | 40.1 | +15.8 | |
| Liberal | Robert Woodthorpe Browne | 8,289 | 15.7 | −7.4 | |
| Majority | 1,392 | 2.6 | -25.8 | ||
| Turnout | 53,133 | 78.7 | +3.5 | ||
| Labour Co-op hold | Swing | −12.9 | |||
| Party | Candidate | Votes | % | ±% | |
|---|---|---|---|---|---|
| Labour Co-op | Stanley Newens | 24,961 | 52.7 | +3.2 | |
| Conservative | James Emerton Smith | 11,510 | 24.3 | −0.7 | |
| Liberal | Basil Goldstone | 10,869 | 23.0 | −2.5 | |
| Majority | 13,451 | 28.4 | +4.4 | ||
| Turnout | 47,340 | 75.2 | −8.7 | ||
| Labour Co-op hold | Swing | +2.0 | |||
| Party | Candidate | Votes | % | ±% | |
|---|---|---|---|---|---|
| Labour Co-op | Stanley Newens | 25,814 | 49.5 | −11.4 | |
| Liberal | Basil Goldstone | 13,280 | 25.5 | +25.5 | |
| Conservative | James Emerton Smith | 13,016 | 25.0 | −14.1 | |
| Majority | 12,534 | 24.0 | +2.2 | ||
| Turnout | 52,110 | 83.9 | +10.0 | ||
| Labour Co-op win (new seat) | |||||
| Party | Candidate | Votes | % | ±% | |
|---|---|---|---|---|---|
| Labour | 29,453 | 60.9 | |||
| Conservative | 18,880 | 39.1 | |||
| Majority | 10,573 | 21.8 | |||
| Turnout | 48,333 | 72.9 | |||
| Labour hold | Swing | ||||
Graphical representation
| 49.5% | 25.5% | 25.0% |
| Labour | Liberal | Conservative |
| 52.7% | 23.0% | 24.3% |
| Labour | Liberal | Conservative |
| 42.7% | 15.7% | 40.1% |
| Labour | Liberal | Conservative |
| 34.2% | 24.2% | 41.1% | |
| Labour | Liberal | Conservative |
| 36.6% | 16.2% | 47.2% |
| Labour | SDP | Conservative |
| 41.8% | 11.3% | 47.0% |
| Labour | Lib Dems | Conservative |
| 54.1% | 9.5% | 32.1% | 3.0% | ||
| Labour | Lib Dems | Conservative | Ref |
| 47.8% | 13.4% | 34.8% | 3.0% | |
| Labour | Lib Dems | Conservative | UKIP |
| 41.4% | 12.6% | 41.2% | ||
| Labour | Lib Dems | Conservative |
| 33.7% | 13.7% | 44.9% | 3.6% | 4.0% | |
| Labour | Lib Dems | Conservative | UKIP | BNP |
| 30.0% | 48.9% | 16.3% | ||||
| Labour | Conservative | UKIP |
| 38.4% | 54.0% | 4.0% | ||
| Labour | Conservative | UKIP |
| 31.0% | 5.5% | 63.5% |
| Labour | LD | Conservative |
See also
Notes
- ↑ A county constituency (for the purposes of election expenses and type of returning officer)
- ↑ As with all constituencies, the constituency elects one Member of Parliament (MP) by the first past the post system of election at least every five years.
References
- ↑ "Electorate Figures - Boundary Commission for England". 2011 Electorate Figures. Boundary Commission for England. 4 March 2011. Archived from the original on 6 November 2010. Retrieved 13 March 2011.
- 1 2 2011 census interactive maps 31.2% of property is socially rented, higher than the other districts in Essex Archived 29 January 2016 at the Wayback Machine
- ↑ "Local statistics - Office for National Statistics". www.ons.gov.uk.
- ↑ "The Parliamentary Constituencies (England) Order 1970". www.legislation.gov.uk. Retrieved 9 September 2019.
- ↑ "The Parliamentary Constituencies (England) Order 1983". www.legislation.gov.uk. Retrieved 9 September 2019.
- ↑ "The Parliamentary Constituencies (England) Order 1995". www.legislation.gov.uk. Retrieved 9 September 2019.
- ↑ "The Parliamentary Constituencies (England) Order 2007". www.legislation.gov.uk. Retrieved 9 September 2019.
- ↑ "The Parliamentary Constituencies Order 2023". Schedule I Part 2 Eastern region.
- ↑ Leigh Rayment's Historical List of MPs – Constituencies beginning with "H" (part 1)
- ↑ "Robert Halfon MP unanimously re-adopted as Harlow's Conservative candidate for next General Election". Your Harlow. Retrieved 2 December 2023.
- ↑ "Chris Vince selected as Labour's Parliamentary candidate for Harlow". Your Harlow. Retrieved 30 November 2023.
- ↑ "Find My PPC (East of England)" (PDF). Reform UK. Retrieved 21 December 2023.
- ↑ "General election results". Harlow Council. Archived from the original on 14 May 2021. Retrieved 8 July 2021.
- ↑ "Election Data 2015". Electoral Calculus. Archived from the original on 17 October 2015. Retrieved 17 October 2015.
- ↑ "Harlow Parliamentary constituency". BBC News. 8 May 2015. Retrieved 8 May 2015.
- ↑ "Election Data 2010". Electoral Calculus. Archived from the original on 26 July 2013. Retrieved 17 October 2015.
- ↑ Statement of Persons Nominated Harlow Council
- ↑ "Election Data 2005". Electoral Calculus. Archived from the original on 15 October 2011. Retrieved 18 October 2015.
- ↑ "Election Data 2001". Electoral Calculus. Archived from the original on 15 October 2011. Retrieved 18 October 2015.
- ↑ "Election Data 1997". Electoral Calculus. Archived from the original on 15 October 2011. Retrieved 18 October 2015.
- ↑ "Election Data 1992". Electoral Calculus. Archived from the original on 15 October 2011. Retrieved 18 October 2015.
- ↑ "Politics Resources". Election 1992. Politics Resources. 9 April 1992. Archived from the original on 24 July 2011. Retrieved 6 December 2010.
- ↑ "Election Data 1987". Electoral Calculus. Archived from the original on 15 October 2011. Retrieved 18 October 2015.
- ↑ "Election Data 1983". Electoral Calculus. Archived from the original on 15 October 2011. Retrieved 18 October 2015.