| Here Grows New York | |
|---|---|
 Image still from the animation | |
| Directed by | Myles Zhang |
| Produced by | Columbia University |
| Music by | Maserati (band) |
Release date |
|
Running time | 9 minutes |
| Country | United States |
| Language | English |
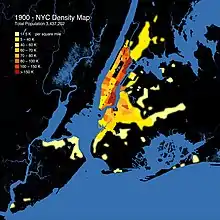
Here Grows New York is a 2018 English-language American urban planning film directed by Myles Zhang and advised by urban historians Kenneth T. Jackson and Gergely Baics. The data visualization follows the history of New York City’s infrastructure and street system development from 1609 to the present day. The video was released onto YouTube by Myles Zhang, an undergraduate in architectural history at Columbia University, on October 25, 2018. The video quickly went viral, gaining over four million views.[1]
Synopsis
Through analysis of geo-referenced historic maps, this film follows the spatial history of New York City’s five boroughs from the initial Dutch settlement of New Amsterdam in the seventeenth century, through the British colonial era, Industrial Revolution, and into the modern era. This illustrates New York City’s slow but steady growth in the pre-modern era, followed by the rapid explosion of the city’s surface area, infrastructure, and population in the twentieth century. The resulting short film presents a sequence of “cartographic snapshots” of the historic extent of urbanized area for every twenty to thirty years. The film ends by rewinding four centuries of urban development in a reverse time-lapse.[2] In the final scene, a quote from E.B. White’s 1949 soliloquy to New York City flashes across the screen: “The city is like poetry: it compresses all life, all races, and breeds, into a small island and adds music and the accompaniment of internal engines.”[3]
Over the past 400 years, humans transformed the natural landscape of hills, rivers and wetlands around New York Harbor into a metropolis. My interest in this transformation began when I started examining old city maps and realized the locations of many city streets correspond to former trails, streams and valleys. For instance, the winding path of Broadway as it slices across the Manhattan grid follows a Lenape Indian trail. Canal Street, where I go to the barber, began life as a drainage ditch in the wet and marshy soil of Lower Manhattan.
— Myles Zhang, in interview with the U.S. Library of Congress[4]
Production and release
Hundreds of maps from the New York Public Library’s digital collections[5] and the Library of Congress[6] were analyzed for this film. The maps most representative of urban development at different intervals in urban history were then selected and incorporated into the animation. Since the source maps all had different scales and graphics, it was necessary to meticulously redraw these old maps with a consistent design.[7] This coherence allowed the rate and trends in urban growth to be read more easily and compared between eras.[8]
In addition to winning the 2019 award for best data visualization from Columbia University’s Data Science Institute,[9] the video is frequently used in introductory urban history courses. The animation was inspired by, or has inspired, similar urban history data visualizations for Amsterdam,[10] London,[11] Barcelona,[12] and Berlin.[13]

Soundtrack
The soundtrack volume rises with the pace of urban growth and has added sound effects of urban life appropriate to each time period New York City's development traveled through. The sounds of nature, water, and machinery evoke the soundscape of each era in urban history. The music is adapted from the 2002 album, The Language of Cities, from the instrumental rock band Maserati.[14]
References
- ↑ "Watch New York City grow from 1609 to today with this animated video assembled from historic maps". 6sqft. 2019-05-13. Archived from the original on 2020-12-22. Retrieved 2020-08-08.
- ↑ "Here Grows New York". Myles Zhang. Archived from the original on 2020-12-22. Retrieved 2020-08-08.
- ↑ "Animations Visualize the Evolution of London and New York: From Their Creation to the Present Day". Open Culture. 2019-04-17. Archived from the original on 2020-12-22. Retrieved 2020-08-08.
- ↑ "Inquiring Minds: Watching New York City Grow, Block by Block". Library of Congress Blog. 2019-05-02. Archived from the original on 2020-12-22. Retrieved 2020-08-08.
- ↑ "New York City maps". New York Public Library: Digital Collections. Archived from the original on 2020-12-22. Retrieved 2020-08-08.
- ↑ "New York City maps". Library of Congress: Digital Collections. Retrieved 2020-08-08.
- ↑ "Bibliography and Research Methodology". Google Drive. 2018-06-11. Archived from the original on 2020-12-22. Retrieved 2020-08-08.
- ↑ "Here Grows New York Workflow". Vimeo. 2018-06-11. Archived from the original on 2020-12-22. Retrieved 2019-10-28.
- ↑ "Data Science Institute at Columbia University Data Art Contest Winners". Columbia University: Data Science Institute. 2019-05-01. Retrieved 2020-08-08.
- ↑ "amsterdam.mp4". YouTube. 2010-10-04. Archived from the original on 2020-12-22. Retrieved 2020-08-08.
- ↑ "The London Evolution Animation". YouTube. 2014-05-07. Archived from the original on 2020-12-22. Retrieved 2020-08-08.
- ↑ "Historic Charter of Barcelona". 300.000 Km/s. 2015-01-01. Archived from the original on 2020-12-22. Retrieved 2020-08-08.
- ↑ "The Berlin Evolution Animation". Myles Zhang. 2020-01-31. Archived from the original on 2020-12-22. Retrieved 2020-08-08.
- ↑ "Maserati Cities". YouTube. 2013-01-24. Archived from the original on 2020-12-22. Retrieved 2020-08-08.