| Himmerland | |
|---|---|
| Himmerland | |
| Nomination district constituency for the Folketing | |
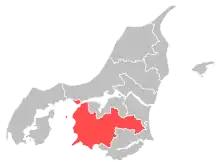
 Location of Himmerland within North Jutland | |
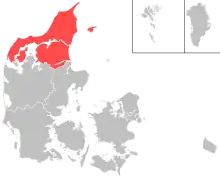
 Location of North Jutland within Denmark | |
| Municipalities | Rebild Vesthimmerland |
| Constituency | North Jutland |
| Electorate | 49,123 (2022)[1] |
| Current constituency | |
| Created | 2007 |
Himmerland nominating district is one of the 92 nominating districts that was created for Danish elections following the 2007 municipal reform.[2][3][4] It consists of Rebild and Vesthimmerland Municipality .[5]
In the 2022 election, it became the nomination district in which parties commonly associated with the blue bloc of Danish politics received the highest % of votes of any located in the North Jutland folketing constituency.[6]
General elections results
General elections in the 2020s
| Parties | Vote | |||||
|---|---|---|---|---|---|---|
| Votes | % | + / - | ||||
| Social Democrats | 11,968 | 28.98 | -0.54 | |||
| Denmark Democrats | 7,872 | 19.06 | New | |||
| Venstre | 6,817 | 16.51 | -15.09 | |||
| Green Left | 2,852 | 6.91 | +0.54 | |||
| Liberal Alliance | 2,424 | 5.87 | +4.38 | |||
| Moderates | 2,285 | 5.53 | New | |||
| Conservatives | 2,207 | 5.34 | -0.08 | |||
| New Right | 1,708 | 4.14 | +2.00 | |||
| Social Liberals | 821 | 1.99 | -2.55 | |||
| Red–Green Alliance | 791 | 1.92 | -1.08 | |||
| Danish People's Party | 760 | 1.84 | -8.72 | |||
| The Alternative | 563 | 1.36 | -0.11 | |||
| Christian Democrats | 147 | 0.36 | -1.11 | |||
| Independent Greens | 51 | 0.12 | New | |||
| Jette Møller | 33 | 0.08 | New | |||
| Total | 41,299 | |||||
| Source[7] | ||||||
General elections in the 2010s
| Parties | Vote | |||||
|---|---|---|---|---|---|---|
| Votes | % | + / - | ||||
| Venstre | 12,830 | 31.60 | +5.41 | |||
| Social Democrats | 11,986 | 29.52 | +3.38 | |||
| Danish People's Party | 4,288 | 10.56 | -14.61 | |||
| Green Left | 2,588 | 6.37 | +3.47 | |||
| Conservatives | 2,199 | 5.42 | +1.97 | |||
| Social Liberals | 1,845 | 4.54 | +1.63 | |||
| Red–Green Alliance | 1,217 | 3.00 | -1.43 | |||
| New Right | 871 | 2.14 | New | |||
| Stram Kurs | 677 | 1.67 | New | |||
| Liberal Alliance | 604 | 1.49 | -4.30 | |||
| The Alternative | 598 | 1.47 | -0.77 | |||
| Christian Democrats | 597 | 1.47 | +0.74 | |||
| Klaus Riskær Pedersen Party | 307 | 0.76 | New | |||
| Total | 40,607 | |||||
| Source[8] | ||||||
| Parties | Vote | |||||
|---|---|---|---|---|---|---|
| Votes | % | + / - | ||||
| Venstre | 10,830 | 26.19 | -5.90 | |||
| Social Democrats | 10,810 | 26.14 | +1.14 | |||
| Danish People's Party | 10,409 | 25.17 | +12.49 | |||
| Liberal Alliance | 2,396 | 5.79 | +1.44 | |||
| Red–Green Alliance | 1,833 | 4.43 | +1.36 | |||
| Conservatives | 1,427 | 3.45 | -2.29 | |||
| Social Liberals | 1,203 | 2.91 | -3.72 | |||
| Green Left | 1,198 | 2.90 | -6.67 | |||
| The Alternative | 928 | 2.24 | New | |||
| Christian Democrats | 303 | 0.73 | -0.10 | |||
| Hans Schultz | 14 | 0.03 | 0.00 | |||
| Total | 41,351 | |||||
| Source[9] | ||||||
| Parties | Vote | |||||
|---|---|---|---|---|---|---|
| Votes | % | + / - | ||||
| Venstre | 13,516 | 32.09 | +2.48 | |||
| Social Democrats | 10,528 | 25.00 | +1.77 | |||
| Danish People's Party | 5,342 | 12.68 | -0.67 | |||
| Green Left | 4,032 | 9.57 | +0.07 | |||
| Social Liberals | 2,793 | 6.63 | +3.00 | |||
| Conservatives | 2,419 | 5.74 | -10.99 | |||
| Liberal Alliance | 1,833 | 4.35 | +2.37 | |||
| Red–Green Alliance | 1,292 | 3.07 | +2.20 | |||
| Christian Democrats | 349 | 0.83 | -0.25 | |||
| Hans Schultz | 13 | 0.03 | +0.02 | |||
| Total | 42,117 | |||||
| Source[10] | ||||||
General elections in the 2000s
| Parties | Vote | |||||
|---|---|---|---|---|---|---|
| Votes | % | + / - | ||||
| Venstre | 12,350 | 29.61 | ||||
| Social Democrats | 9,690 | 23.23 | ||||
| Conservatives | 6,979 | 16.73 | ||||
| Danish People's Party | 5,567 | 13.35 | ||||
| Green Left | 3,961 | 9.50 | ||||
| Social Liberals | 1,513 | 3.63 | ||||
| New Alliance | 826 | 1.98 | ||||
| Christian Democrats | 449 | 1.08 | ||||
| Red–Green Alliance | 363 | 0.87 | ||||
| Anders Gravers Pedersen | 7 | 0.02 | ||||
| Hans Schultz | 3 | 0.01 | ||||
| Total | 41,708 | |||||
| Source[11] | ||||||
European Parliament elections results
2019 European Parliament election in Denmark
| Parties | Vote | |||||
|---|---|---|---|---|---|---|
| Votes | % | + / - | ||||
| Venstre | 12,092 | 39.26 | +16.98 | |||
| Social Democrats | 6,594 | 21.41 | +4.58 | |||
| Danish People's Party | 3,410 | 11.07 | -18.46 | |||
| Green Left | 2,639 | 8.57 | +0.89 | |||
| Social Liberals | 1,849 | 6.00 | +1.67 | |||
| Conservatives | 1,322 | 4.29 | -5.80 | |||
| People's Movement against the EU | 1,036 | 3.36 | -3.40 | |||
| Red–Green Alliance | 879 | 2.85 | New | |||
| The Alternative | 509 | 1.65 | New | |||
| Liberal Alliance | 473 | 1.54 | -0.95 | |||
| Total | 30,803 | |||||
| Source[12] | ||||||
2014 European Parliament election in Denmark
| Parties | Vote | |||||
|---|---|---|---|---|---|---|
| Votes | % | + / - | ||||
| Danish People's Party | 7,290 | 29.53 | +15.46 | |||
| Venstre | 5,501 | 22.28 | -6.08 | |||
| Social Democrats | 4,155 | 16.83 | -1.70 | |||
| Conservatives | 2,492 | 10.09 | -4.56 | |||
| Green Left | 1,897 | 7.68 | -4.84 | |||
| People's Movement against the EU | 1,668 | 6.76 | +2.12 | |||
| Social Liberals | 1,069 | 4.33 | +1.41 | |||
| Liberal Alliance | 614 | 2.49 | +2.08 | |||
| Total | 24,686 | |||||
| Source[13] | ||||||
2009 European Parliament election in Denmark
| Parties | Vote | |||||
|---|---|---|---|---|---|---|
| Votes | % | + / - | ||||
| Venstre | 7,648 | 28.36 | ||||
| Social Democrats | 4,998 | 18.53 | ||||
| Conservatives | 3,950 | 14.65 | ||||
| Danish People's Party | 3,794 | 14.07 | ||||
| Green Left | 3,376 | 12.52 | ||||
| People's Movement against the EU | 1,251 | 4.64 | ||||
| June Movement | 1,054 | 3.91 | ||||
| Social Liberals | 787 | 2.92 | ||||
| Liberal Alliance | 110 | 0.41 | ||||
| Total | 26,968 | |||||
| Source[14] | ||||||
Referendums
2022 Danish European Union opt-out referendum[15]
| Option | Votes | % |
|---|---|---|
| ✓ YES | 20,651 | 65.22 |
| X NO | 11,014 | 34.78 |
2015 Danish European Union opt-out referendum[16]
| Option | Votes | % |
|---|---|---|
| X NO | 18,608 | 54.53 |
| ✓ YES | 15,517 | 45.47 |
2014 Danish Unified Patent Court membership referendum[17]
| Option | Votes | % |
|---|---|---|
| ✓ YES | 15,427 | 64.26 |
| X NO | 8,580 | 35.74 |
2009 Danish Act of Succession referendum[18]
| Option | Votes | % |
|---|---|---|
| ✓ YES | 22,636 | 86.65 |
| X NO | 3,488 | 13.35 |
References
- ↑ "Himmerlandkredsen". kmdvalg.dk (in Danish). Retrieved 2023-06-02.
- ↑ "Nye valgkredse fordeler stemmerne anderledes". dr.dk (in Danish). Retrieved 2023-06-02.
- ↑ "Beretning om nye valgkredse som følge af kommunalreformen" (in Danish). Retrieved 2023-06-02.
- ↑ "Det danske valgsystem: Valg til Folketinget". valg.im (in Danish). Retrieved 2023-06-02.
- ↑ "88 Himmerland". dataforsyningen.dk (in Danish). Retrieved 2023-06-02.
- ↑ "Folketingsvalg Tirsdag 1. November 2022". dst.dk (in Danish). Retrieved 2023-06-02.
- ↑ "FOLKETINGSVALG TIRSDAG 1. NOVEMBER 2022". valg.im (in Danish). Retrieved 2023-06-27.
- ↑ "FOLKETINGSVALG ONSDAG 5. JUNI 2019". valg.im (in Danish). Retrieved 2023-06-27.
- ↑ "FOLKETINGSVALG TORSDAG 18. JUNI 2015". valg.im (in Danish). Retrieved 2023-06-27.
- ↑ "FOLKETINGSVALG TORSDAG 15. SEPTEMBER 2011". valg.im (in Danish). Retrieved 2023-06-27.
- ↑ "Folketingsvalget den 13. november 2007". valg.im (in Danish). Retrieved 2023-06-27.
- ↑ "EUROPA-PARLAMENTSVALG SØNDAG 26. MAJ 2019". dst.dk (in Danish). Retrieved 2023-07-01.
- ↑ "EUROPA-PARLAMENTSVALG SØNDAG 25. MAJ 2014". dst.dk (in Danish). Retrieved 2023-07-01.
- ↑ "EUROPA-PARLAMENTSVALG SØNDAG 7. JUNI 2009". dst.dk (in Danish). Retrieved 2023-07-01.
- ↑ "FOLKEAFSTEMNING ONSDAG 1. JUNI 2022". dst.dk (in Danish). Retrieved 2023-07-05.
- ↑ "FOLKEAFSTEMNING TORSDAG 3. DECEMBER 2015". dst.dk (in Danish). Retrieved 2023-07-05.
- ↑ "FOLKEAFSTEMNING SØNDAG 25. MAJ 2014". dst.dk (in Danish). Retrieved 2023-07-05.
- ↑ "FOLKEAFSTEMNING SØNDAG 7. JUNI 2009". dst.dk (in Danish). Retrieved 2023-07-05.