| Holbæk | |
|---|---|
| Holbæk | |
| Nomination district constituency for the Folketing | |
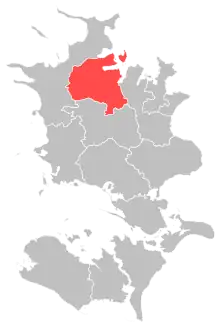 Location of Holbæk within Zealand | |
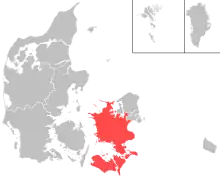 Location of Zealand within Denmark | |
| Municipalities | Holbæk |
| Constituency | Zealand |
| Electorate | 54,352 (2022)[1] |
| Current constituency | |
| Created | 1849 (as constituency)[2] 1920 (as nomination district) |
Holbæk nominating district is one of the 92 nominating districts that exists for Danish elections following the 2007 municipal reform.[3][4][5] It consists of Holbæk Municipality.[6] It was created in 1849 as a constituency,[7] and has been a nomination district since 1920, though its boundaries have been changed since then.
In general elections, the district often votes close to the national results when looking at the voter split between the two blocs. However it has trended towards voting more for parties commonly associated with the red bloc, and was one of only two nomination districts where the bloc increased their vote share in the 2022 election.[8]
General elections results
General elections in the 2020s
| Parties | Vote | |||||
|---|---|---|---|---|---|---|
| Votes | % | + / - | ||||
| Social Democrats | 13,954 | 31.24 | +2.19 | |||
| Green Left | 5,239 | 11.73 | +4.48 | |||
| Venstre | 5,230 | 11.71 | -11.96 | |||
| Moderates | 4,876 | 10.92 | New | |||
| Denmark Democrats | 3,416 | 7.65 | New | |||
| Liberal Alliance | 2,922 | 6.54 | +4.53 | |||
| New Right | 1,853 | 4.15 | +1.93 | |||
| Conservatives | 1,678 | 3.76 | -2.12 | |||
| Danish People's Party | 1,620 | 3.63 | -6.91 | |||
| Red–Green Alliance | 1,537 | 3.44 | -2.63 | |||
| Social Liberals | 1,043 | 2.34 | -4.14 | |||
| The Alternative | 840 | 1.88 | -0.24 | |||
| Independent Greens | 274 | 0.61 | New | |||
| Christian Democrats | 117 | 0.26 | -0.60 | |||
| Lisa Sofia Larsson | 34 | 0.08 | New | |||
| Rasmus Paludan | 32 | 0.07 | New | |||
| Total | 44,665 | |||||
| Source[9] | ||||||
General elections in the 2010s
| Parties | Vote | |||||
|---|---|---|---|---|---|---|
| Votes | % | + / - | ||||
| Social Democrats | 12,772 | 29.05 | +1.09 | |||
| Venstre | 10,408 | 23.67 | +3.76 | |||
| Danish People's Party | 4,632 | 10.54 | -12.82 | |||
| Green Left | 3,189 | 7.25 | +3.93 | |||
| Social Liberals | 2,849 | 6.48 | +2.11 | |||
| Red–Green Alliance | 2,667 | 6.07 | -1.77 | |||
| Conservatives | 2,586 | 5.88 | +2.76 | |||
| Stram Kurs | 1,102 | 2.51 | New | |||
| New Right | 975 | 2.22 | New | |||
| The Alternative | 934 | 2.12 | -1.47 | |||
| Liberal Alliance | 884 | 2.01 | -4.08 | |||
| Klaus Riskær Pedersen Party | 540 | 1.23 | New | |||
| Christian Democrats | 377 | 0.86 | +0.44 | |||
| Pinki Karin Yvonne Jensen | 49 | 0.11 | New | |||
| Total | 43,964 | |||||
| Source[10] | ||||||
| Parties | Vote | |||||
|---|---|---|---|---|---|---|
| Votes | % | + / - | ||||
| Social Democrats | 12,173 | 27.96 | +2.08 | |||
| Danish People's Party | 10,167 | 23.36 | +8.90 | |||
| Venstre | 8,666 | 19.91 | -6.44 | |||
| Red–Green Alliance | 3,414 | 7.84 | +1.71 | |||
| Liberal Alliance | 2,650 | 6.09 | +1.82 | |||
| Social Liberals | 1,901 | 4.37 | -4.02 | |||
| The Alternative | 1,563 | 3.59 | New | |||
| Green Left | 1,447 | 3.32 | -5.88 | |||
| Conservatives | 1,357 | 3.12 | -1.73 | |||
| Christian Democrats | 182 | 0.42 | -0.01 | |||
| Aamer Ahmad | 10 | 0.02 | New | |||
| Michael Christiansen | 1 | 0.00 | New | |||
| Bent A. Jespersen | 0 | 0.00 | 0.00 | |||
| Total | 43,531 | |||||
| Source[11] | ||||||
| Parties | Vote | |||||
|---|---|---|---|---|---|---|
| Votes | % | + / - | ||||
| Venstre | 11,657 | 26.35 | -1.10 | |||
| Social Democrats | 11,449 | 25.88 | +0.40 | |||
| Danish People's Party | 6,396 | 14.46 | -0.77 | |||
| Green Left | 4,071 | 9.20 | -3.38 | |||
| Social Liberals | 3,712 | 8.39 | +3.13 | |||
| Red–Green Alliance | 2,713 | 6.13 | +4.33 | |||
| Conservatives | 2,146 | 4.85 | -3.91 | |||
| Liberal Alliance | 1,890 | 4.27 | +1.28 | |||
| Christian Democrats | 191 | 0.43 | -0.03 | |||
| Johan Isbrandt Haulik | 11 | 0.02 | New | |||
| Peter Lotinga | 6 | 0.01 | New | |||
| Bent A. Jespersen | 2 | 0.00 | New | |||
| Total | 44,244 | |||||
| Source[12] | ||||||
General elections in the 2000s
| Parties | Vote | |||||
|---|---|---|---|---|---|---|
| Votes | % | + / - | ||||
| Venstre | 11,931 | 27.45 | -2.08 | |||
| Social Democrats | 11,075 | 25.48 | +0.19 | |||
| Danish People's Party | 6,620 | 15.23 | +2.25 | |||
| Green Left | 5,468 | 12.58 | +6.10 | |||
| Conservatives | 3,809 | 8.76 | -0.95 | |||
| Social Liberals | 2,286 | 5.26 | -4.87 | |||
| New Alliance | 1,300 | 2.99 | New | |||
| Red–Green Alliance | 781 | 1.80 | -1.40 | |||
| Christian Democrats | 202 | 0.46 | -0.70 | |||
| Total | 43,472 | |||||
| Source[13] | ||||||
| Parties | Vote | |||||
|---|---|---|---|---|---|---|
| Votes | % | + / - | ||||
| Venstre | 10,894 | 29.53 | +1.63 | |||
| Social Democrats | 9,330 | 25.29 | -3.31 | |||
| Danish People's Party | 4,791 | 12.98 | +1.93 | |||
| Social Liberals | 3,736 | 10.13 | +3.81 | |||
| Conservatives | 3,581 | 9.71 | -3.63 | |||
| Green Left | 2,392 | 6.48 | -0.24 | |||
| Red–Green Alliance | 1,181 | 3.20 | +1.03 | |||
| Centre Democrats | 482 | 1.31 | -0.32 | |||
| Christian Democrats | 429 | 1.16 | -0.55 | |||
| Minority Party | 77 | 0.21 | New | |||
| Bent A. Jespersen | 4 | 0.01 | New | |||
| Total | 36,897 | |||||
| Source[14] | ||||||
| Parties | Vote | |||||
|---|---|---|---|---|---|---|
| Votes | % | + / - | ||||
| Social Democrats | 10,681 | 28.60 | -6.95 | |||
| Venstre | 10,422 | 27.90 | +5.96 | |||
| Conservatives | 4,981 | 13.34 | +2.55 | |||
| Danish People's Party | 4,127 | 11.05 | +3.98 | |||
| Green Left | 2,509 | 6.72 | -1.53 | |||
| Social Liberals | 2,361 | 6.32 | +0.39 | |||
| Red–Green Alliance | 809 | 2.17 | -0.36 | |||
| Christian People's Party | 638 | 1.71 | -0.10 | |||
| Centre Democrats | 608 | 1.63 | -2.90 | |||
| Progress Party | 175 | 0.47 | -0.84 | |||
| Mark Hulstrøm | 39 | 0.10 | New | |||
| Total | 37,350 | |||||
| Source[15] | ||||||
General elections in the 1990s
| Parties | Vote | |||||
|---|---|---|---|---|---|---|
| Votes | % | + / - | ||||
| Social Democrats | 12,895 | 35.55 | +1.25 | |||
| Venstre | 7,958 | 21.94 | -0.36 | |||
| Conservatives | 3,914 | 10.79 | -3.74 | |||
| Green Left | 2,994 | 8.25 | +0.02 | |||
| Danish People's Party | 2,564 | 7.07 | New | |||
| Social Liberals | 2,152 | 5.93 | -1.86 | |||
| Centre Democrats | 1,642 | 4.53 | +1.58 | |||
| Red–Green Alliance | 918 | 2.53 | -0.54 | |||
| Christian People's Party | 656 | 1.81 | +0.45 | |||
| Progress Party | 474 | 1.31 | -4.12 | |||
| Democratic Renewal | 86 | 0.24 | New | |||
| Bent A. Jespersen | 20 | 0.06 | New | |||
| Total | 36,273 | |||||
| Source[16] | ||||||
| Parties | Vote | |||||
|---|---|---|---|---|---|---|
| Votes | % | + / - | ||||
| Social Democrats | 12,047 | 34.30 | -2.58 | |||
| Venstre | 7,832 | 22.30 | +8.56 | |||
| Conservatives | 5,102 | 14.53 | -1.55 | |||
| Green Left | 2,889 | 8.23 | -0.78 | |||
| Social Liberals | 2,736 | 7.79 | +0.09 | |||
| Progress Party | 1,906 | 5.43 | +0.16 | |||
| Red–Green Alliance | 1,080 | 3.07 | +1.53 | |||
| Centre Democrats | 1,037 | 2.95 | -1.96 | |||
| Christian People's Party | 478 | 1.36 | -0.14 | |||
| Grethe Lindberg | 12 | 0.03 | New | |||
| Henning Moth | 5 | 0.01 | New | |||
| Total | 35,124 | |||||
| Source[17] | ||||||
| Parties | Vote | |||||
|---|---|---|---|---|---|---|
| Votes | % | + / - | ||||
| Social Democrats | 12,560 | 36.88 | +8.38 | |||
| Conservatives | 5,476 | 16.08 | -2.81 | |||
| Venstre | 4,678 | 13.74 | +3.93 | |||
| Green Left | 3,067 | 9.01 | -4.74 | |||
| Social Liberals | 2,621 | 7.70 | -2.54 | |||
| Progress Party | 1,794 | 5.27 | -2.86 | |||
| Centre Democrats | 1,671 | 4.91 | +0.85 | |||
| Common Course | 666 | 1.96 | -0.65 | |||
| Red–Green Alliance | 526 | 1.54 | New | |||
| Christian People's Party | 512 | 1.50 | +0.08 | |||
| The Greens | 301 | 0.88 | -0.50 | |||
| Justice Party of Denmark | 169 | 0.50 | New | |||
| Humanist Party | 16 | 0.05 | New | |||
| Total | 34,057 | |||||
| Source[18] | ||||||
General elections in the 1980s
| Parties | Vote | |||||
|---|---|---|---|---|---|---|
| Votes | % | + / - | ||||
| Social Democrats | 9,893 | 28.50 | +0.16 | |||
| Conservatives | 6,556 | 18.89 | -1.42 | |||
| Green Left | 4,774 | 13.75 | -1.26 | |||
| Social Liberals | 3,553 | 10.24 | -0.45 | |||
| Venstre | 3,404 | 9.81 | +0.70 | |||
| Progress Party | 2,822 | 8.13 | +4.28 | |||
| Centre Democrats | 1,408 | 4.06 | +0.10 | |||
| Common Course | 907 | 2.61 | -0.41 | |||
| Christian People's Party | 492 | 1.42 | -0.21 | |||
| The Greens | 478 | 1.38 | +0.03 | |||
| Communist Party of Denmark | 221 | 0.64 | -0.12 | |||
| Left Socialists | 190 | 0.55 | -0.58 | |||
| Søren Barder | 16 | 0.05 | New | |||
| Total | 34,714 | |||||
| Source[19] | ||||||
| Parties | Vote | |||||
|---|---|---|---|---|---|---|
| Votes | % | + / - | ||||
| Social Democrats | 9,942 | 28.34 | -3.38 | |||
| Conservatives | 7,123 | 20.31 | -3.55 | |||
| Green Left | 5,264 | 15.01 | +3.61 | |||
| Social Liberals | 3,751 | 10.69 | +0.77 | |||
| Venstre | 3,196 | 9.11 | -0.92 | |||
| Centre Democrats | 1,388 | 3.96 | +0.06 | |||
| Progress Party | 1,351 | 3.85 | +0.93 | |||
| Common Course | 1,058 | 3.02 | New | |||
| Christian People's Party | 573 | 1.63 | -0.49 | |||
| The Greens | 475 | 1.35 | New | |||
| Left Socialists | 395 | 1.13 | -1.16 | |||
| Communist Party of Denmark | 267 | 0.76 | +0.24 | |||
| Justice Party of Denmark | 159 | 0.45 | -0.79 | |||
| Humanist Party | 97 | 0.28 | New | |||
| Socialist Workers Party | 27 | 0.08 | +0.04 | |||
| Marxist–Leninists Party | 12 | 0.03 | +0.02 | |||
| Total | 35,078 | |||||
| Source[20] | ||||||
| Parties | Vote | |||||
|---|---|---|---|---|---|---|
| Votes | % | + / - | ||||
| Social Democrats | 10,822 | 31.72 | -0.57 | |||
| Conservatives | 8,140 | 23.86 | +10.90 | |||
| Green Left | 3,890 | 11.40 | +1.25 | |||
| Venstre | 3,423 | 10.03 | +0.23 | |||
| Social Liberals | 3,384 | 9.92 | -1.46 | |||
| Centre Democrats | 1,332 | 3.90 | -4.67 | |||
| Progress Party | 995 | 2.92 | -5.65 | |||
| Left Socialists | 782 | 2.29 | +0.17 | |||
| Christian People's Party | 722 | 2.12 | +0.36 | |||
| Justice Party of Denmark | 422 | 1.24 | +0.08 | |||
| Communist Party of Denmark | 179 | 0.52 | -0.41 | |||
| Socialist Workers Party | 15 | 0.04 | -0.04 | |||
| Marxist–Leninists Party | 5 | 0.01 | New | |||
| Bent E. Jespersen | 4 | 0.01 | New | |||
| Total | 34,115 | |||||
| Source[21] | ||||||
| Parties | Vote | |||||
|---|---|---|---|---|---|---|
| Votes | % | + / - | ||||
| Social Democrats | 10,157 | 32.29 | -5.51 | |||
| Conservatives | 4,076 | 12.96 | +1.17 | |||
| Social Liberals | 3,580 | 11.38 | +0.28 | |||
| Green Left | 3,194 | 10.15 | +5.30 | |||
| Venstre | 3,084 | 9.80 | -1.89 | |||
| Centre Democrats | 2,696 | 8.57 | +5.43 | |||
| Progress Party | 2,695 | 8.57 | -1.61 | |||
| Left Socialists | 668 | 2.12 | -1.05 | |||
| Christian People's Party | 554 | 1.76 | -0.18 | |||
| Justice Party of Denmark | 365 | 1.16 | -1.08 | |||
| Communist Party of Denmark | 292 | 0.93 | -0.82 | |||
| Communist Workers Party | 53 | 0.17 | -0.18 | |||
| Socialist Workers Party | 25 | 0.08 | New | |||
| Kai Linde | 17 | 0.05 | New | |||
| Total | 31,456 | |||||
| Source[22] | ||||||
General elections in the 1970s
| Parties | Vote | |||||
|---|---|---|---|---|---|---|
| Votes | % | + / - | ||||
| Social Democrats | 12,100 | 37.80 | +1.01 | |||
| Conservatives | 3,775 | 11.79 | +3.58 | |||
| Venstre | 3,741 | 11.69 | +0.54 | |||
| Social Liberals | 3,554 | 11.10 | +1.73 | |||
| Progress Party | 3,260 | 10.18 | -3.07 | |||
| Green Left | 1,553 | 4.85 | +2.06 | |||
| Left Socialists | 1,015 | 3.17 | +0.84 | |||
| Centre Democrats | 1,006 | 3.14 | -3.34 | |||
| Justice Party of Denmark | 716 | 2.24 | -0.46 | |||
| Christian People's Party | 622 | 1.94 | -1.07 | |||
| Communist Party of Denmark | 559 | 1.75 | -1.31 | |||
| Communist Workers Party | 112 | 0.35 | New | |||
| Total | 32,013 | |||||
| Source[23] | ||||||
| Parties | Vote | |||||
|---|---|---|---|---|---|---|
| Votes | % | + / - | ||||
| Social Democrats | 11,310 | 36.79 | +7.28 | |||
| Progress Party | 4,074 | 13.25 | +0.93 | |||
| Venstre | 3,428 | 11.15 | -9.87 | |||
| Social Liberals | 2,880 | 9.37 | -5.90 | |||
| Conservatives | 2,525 | 8.21 | +3.46 | |||
| Centre Democrats | 1,993 | 6.48 | +4.28 | |||
| Communist Party of Denmark | 942 | 3.06 | -0.17 | |||
| Christian People's Party | 926 | 3.01 | -1.83 | |||
| Green Left | 858 | 2.79 | -0.97 | |||
| Justice Party of Denmark | 831 | 2.70 | +1.23 | |||
| Left Socialists | 715 | 2.33 | +0.71 | |||
| Pensioners' Party | 264 | 0.86 | New | |||
| Total | 30,746 | |||||
| Source[24] | ||||||
| Parties | Vote | |||||
|---|---|---|---|---|---|---|
| Votes | % | + / - | ||||
| Social Democrats | 8,739 | 29.51 | +5.04 | |||
| Venstre | 6,226 | 21.02 | +8.40 | |||
| Social Liberals | 4,521 | 15.27 | -2.70 | |||
| Progress Party | 3,649 | 12.32 | -2.49 | |||
| Christian People's Party | 1,433 | 4.84 | +1.57 | |||
| Conservatives | 1,407 | 4.75 | -2.96 | |||
| Green Left | 1,113 | 3.76 | -0.68 | |||
| Communist Party of Denmark | 958 | 3.23 | +0.47 | |||
| Centre Democrats | 652 | 2.20 | -6.10 | |||
| Left Socialists | 480 | 1.62 | +0.37 | |||
| Justice Party of Denmark | 435 | 1.47 | -0.92 | |||
| N. Vestergård Eriksen | 2 | 0.01 | New | |||
| Egon Larsen | 1 | 0.00 | New | |||
| Total | 29,616 | |||||
| Source[25] | ||||||
| Parties | Vote | |||||
|---|---|---|---|---|---|---|
| Votes | % | + / - | ||||
| Social Democrats | 7,192 | 24.47 | -11.56 | |||
| Social Liberals | 5,283 | 17.97 | -4.33 | |||
| Progress Party | 4,353 | 14.81 | New | |||
| Venstre | 3,711 | 12.62 | -3.78 | |||
| Centre Democrats | 2,441 | 8.30 | New | |||
| Conservatives | 2,266 | 7.71 | -5.54 | |||
| Green Left | 1,305 | 4.44 | -2.32 | |||
| Christian People's Party | 962 | 3.27 | +1.58 | |||
| Communist Party of Denmark | 812 | 2.76 | +1.73 | |||
| Justice Party of Denmark | 703 | 2.39 | +1.20 | |||
| Left Socialists | 367 | 1.25 | -0.10 | |||
| Total | 29,395 | |||||
| Source[26] | ||||||
| Parties | Vote | |||||
|---|---|---|---|---|---|---|
| Votes | % | + / - | ||||
| Social Democrats | 9,833 | 36.03 | +3.47 | |||
| Social Liberals | 6,084 | 22.30 | -2.11 | |||
| Venstre | 4,475 | 16.40 | -2.39 | |||
| Conservatives | 3,617 | 13.25 | -2.25 | |||
| Green Left | 1,845 | 6.76 | +2.85 | |||
| Christian People's Party | 460 | 1.69 | New | |||
| Left Socialists | 369 | 1.35 | -0.34 | |||
| Justice Party of Denmark | 324 | 1.19 | +0.61 | |||
| Communist Party of Denmark | 281 | 1.03 | +0.04 | |||
| Total | 27,288 | |||||
| Source[27] | ||||||
General elections in the 1960s
| Parties | Vote | |||||
|---|---|---|---|---|---|---|
| Votes | % | + / - | ||||
| Social Democrats | 7,068 | 32.56 | -5.02 | |||
| Social Liberals | 5,298 | 24.41 | +8.08 | |||
| Venstre | 4,078 | 18.79 | -1.42 | |||
| Conservatives | 3,365 | 15.50 | +1.43 | |||
| Green Left | 849 | 3.91 | -3.29 | |||
| Left Socialists | 366 | 1.69 | New | |||
| Liberal Centre | 248 | 1.14 | -0.90 | |||
| Communist Party of Denmark | 215 | 0.99 | +0.23 | |||
| Justice Party of Denmark | 125 | 0.58 | -0.04 | |||
| Independent Party | 95 | 0.44 | -0.75 | |||
| Total | 21,707 | |||||
| Source[28] | ||||||
| Parties | Vote | |||||
|---|---|---|---|---|---|---|
| Votes | % | + / - | ||||
| Social Democrats | 7,968 | 37.58 | -1.97 | |||
| Venstre | 4,284 | 20.21 | -1.76 | |||
| Social Liberals | 3,462 | 16.33 | +1.32 | |||
| Conservatives | 2,982 | 14.07 | -1.11 | |||
| Green Left | 1,526 | 7.20 | +3.89 | |||
| Liberal Centre | 433 | 2.04 | New | |||
| Independent Party | 252 | 1.19 | -0.60 | |||
| Communist Party of Denmark | 162 | 0.76 | -0.40 | |||
| Justice Party of Denmark | 131 | 0.62 | -0.65 | |||
| Total | 21,200 | |||||
| Source[29] | ||||||
| Parties | Vote | |||||
|---|---|---|---|---|---|---|
| Votes | % | + / - | ||||
| Social Democrats | 7,797 | 39.55 | +2.32 | |||
| Venstre | 4,332 | 21.97 | -1.60 | |||
| Conservatives | 2,993 | 15.18 | +2.87 | |||
| Social Liberals | 2,960 | 15.01 | -3.20 | |||
| Green Left | 653 | 3.31 | -0.49 | |||
| Independent Party | 353 | 1.79 | -0.09 | |||
| Justice Party of Denmark | 250 | 1.27 | -0.84 | |||
| Communist Party of Denmark | 228 | 1.16 | +0.27 | |||
| Peace Politics People's Party | 88 | 0.45 | New | |||
| Danish Unity | 62 | 0.31 | New | |||
| Total | 19,716 | |||||
| Source[30] | ||||||
| Parties | Vote | |||||
|---|---|---|---|---|---|---|
| Votes | % | + / - | ||||
| Social Democrats | 6,902 | 37.23 | +3.52 | |||
| Venstre | 4,369 | 23.57 | -3.57 | |||
| Social Liberals | 3,377 | 18.21 | -4.38 | |||
| Conservatives | 2,282 | 12.31 | +1.42 | |||
| Green Left | 704 | 3.80 | New | |||
| Justice Party of Denmark | 392 | 2.11 | -0.88 | |||
| Independent Party | 349 | 1.88 | +1.20 | |||
| Communist Party of Denmark | 165 | 0.89 | -1.11 | |||
| Total | 18,540 | |||||
| Source[31] | ||||||
General elections in the 1950s
| Parties | Vote | |||||
|---|---|---|---|---|---|---|
| Votes | % | + / - | ||||
| Social Democrats | 6,049 | 33.71 | -2.20 | |||
| Venstre | 4,869 | 27.14 | +1.65 | |||
| Social Liberals | 4,054 | 22.59 | -0.15 | |||
| Conservatives | 1,954 | 10.89 | +0.79 | |||
| Justice Party of Denmark | 536 | 2.99 | +0.49 | |||
| Communist Party of Denmark | 359 | 2.00 | -0.45 | |||
| Independent Party | 122 | 0.68 | -0.13 | |||
| Total | 17,943 | |||||
| Source[32] | ||||||
September 1953 Danish Folketing election
| Parties | Vote | |||||
|---|---|---|---|---|---|---|
| Votes | % | + / - | ||||
| Social Democrats | 6,268 | 35.91 | +2.33 | |||
| Venstre | 4,449 | 25.49 | +1.26 | |||
| Social Liberals | 3,968 | 22.74 | -2.12 | |||
| Conservatives | 1,763 | 10.10 | +0.17 | |||
| Justice Party of Denmark | 437 | 2.50 | -1.10 | |||
| Communist Party of Denmark | 427 | 2.45 | -0.39 | |||
| Independent Party | 141 | 0.81 | New | |||
| Total | 17,453 | |||||
| Source[33] | ||||||
April 1953 Danish Folketing election
| Parties | Vote | |||||
|---|---|---|---|---|---|---|
| Votes | % | + / - | ||||
| Social Democrats | 5,659 | 33.58 | -1.09 | |||
| Social Liberals | 4,190 | 24.86 | -0.33 | |||
| Venstre | 4,084 | 24.23 | +2.01 | |||
| Conservatives | 1,674 | 9.93 | -0.97 | |||
| Justice Party of Denmark | 607 | 3.60 | -0.89 | |||
| Communist Party of Denmark | 479 | 2.84 | +0.31 | |||
| Danish Unity | 161 | 0.96 | New | |||
| Total | 16,854 | |||||
| Source[34] | ||||||
1950 Danish Folketing election
| Parties | Vote | |||||
|---|---|---|---|---|---|---|
| Votes | % | + / - | ||||
| Social Democrats | 5,787 | 34.67 | -1.47 | |||
| Social Liberals | 4,205 | 25.19 | +3.20 | |||
| Venstre | 3,710 | 22.22 | -4.50 | |||
| Conservatives | 1,819 | 10.90 | +3.79 | |||
| Justice Party of Denmark | 750 | 4.49 | +1.75 | |||
| Communist Party of Denmark | 422 | 2.53 | -1.48 | |||
| Total | 16,693 | |||||
| Source[35] | ||||||
General elections in the 1940s
1947 Danish Folketing election
| Parties | Vote | |||||
|---|---|---|---|---|---|---|
| Votes | % | + / - | ||||
| Social Democrats | 6,111 | 36.14 | +6.09 | |||
| Venstre | 4,518 | 26.72 | +3.46 | |||
| Social Liberals | 3,718 | 21.99 | -0.94 | |||
| Conservatives | 1,202 | 7.11 | -3.98 | |||
| Communist Party of Denmark | 678 | 4.01 | -4.12 | |||
| Justice Party of Denmark | 464 | 2.74 | +1.05 | |||
| Danish Unity | 218 | 1.29 | -1.55 | |||
| Total | 16,909 | |||||
| Source[36] | ||||||
1945 Danish Folketing election
| Parties | Vote | |||||
|---|---|---|---|---|---|---|
| Votes | % | + / - | ||||
| Social Democrats | 5,039 | 30.05 | -6.65 | |||
| Venstre | 3,900 | 23.26 | +2.55 | |||
| Social Liberals | 3,845 | 22.93 | -1.99 | |||
| Conservatives | 1,860 | 11.09 | -1.90 | |||
| Communist Party of Denmark | 1,364 | 8.13 | New | |||
| Danish Unity | 477 | 2.84 | +1.37 | |||
| Justice Party of Denmark | 284 | 1.69 | -0.20 | |||
| Total | 16,769 | |||||
| Source[37] | ||||||
1943 Danish Folketing election
| Parties | Vote | |||||
|---|---|---|---|---|---|---|
| Votes | % | + / - | ||||
| Social Democrats | 6,013 | 36.70 | +4.46 | |||
| Social Liberals | 4,084 | 24.92 | -1.00 | |||
| Venstre | 3,393 | 20.71 | +0.06 | |||
| Conservatives | 2,129 | 12.99 | +1.07 | |||
| Justice Party of Denmark | 310 | 1.89 | -1.58 | |||
| Danish Unity | 241 | 1.47 | +1.12 | |||
| National Socialist Workers' Party of Denmark | 168 | 1.03 | -0.81 | |||
| Farmers' Party | 48 | 0.29 | -0.41 | |||
| Total | 16,386 | |||||
| Source[38] | ||||||
General elections in the 1930s
1939 Danish Folketing election
| Parties | Vote | |||||
|---|---|---|---|---|---|---|
| Votes | % | + / - | ||||
| Social Democrats | 4,699 | 32.24 | -4.33 | |||
| Social Liberals | 3,778 | 25.92 | +1.64 | |||
| Venstre | 3,010 | 20.65 | +1.19 | |||
| Conservatives | 1,737 | 11.92 | -0.07 | |||
| Justice Party of Denmark | 506 | 3.47 | -1.25 | |||
| Communist Party of Denmark | 398 | 2.73 | +1.66 | |||
| National Socialist Workers' Party of Denmark | 268 | 1.84 | +1.08 | |||
| Farmers' Party | 102 | 0.70 | -0.46 | |||
| Danish Unity | 51 | 0.35 | New | |||
| National Cooperation | 26 | 0.18 | New | |||
| Total | 14,575 | |||||
| Source[39] | ||||||
1935 Danish Folketing election
| Parties | Vote | |||||
|---|---|---|---|---|---|---|
| Votes | % | + / - | ||||
| Social Democrats | 5,279 | 36.57 | +3.07 | |||
| Social Liberals | 3,505 | 24.28 | -1.87 | |||
| Venstre | 2,809 | 19.46 | -5.14 | |||
| Conservatives | 1,731 | 11.99 | -0.02 | |||
| Justice Party of Denmark | 682 | 4.72 | +1.46 | |||
| Independent People's Party | 168 | 1.16 | New | |||
| Communist Party of Denmark | 154 | 1.07 | +0.59 | |||
| National Socialist Workers' Party of Denmark | 109 | 0.76 | New | |||
| Total | 14,437 | |||||
| Source[40] | ||||||
1932 Danish Folketing election
| Parties | Vote | |||||
|---|---|---|---|---|---|---|
| Votes | % | + / - | ||||
| Social Democrats | 4,724 | 33.50 | +1.28 | |||
| Social Liberals | 3,688 | 26.15 | -1.68 | |||
| Venstre | 3,469 | 24.60 | -3.72 | |||
| Conservatives | 1,694 | 12.01 | +2.55 | |||
| Justice Party of Denmark | 459 | 3.26 | +1.42 | |||
| Communist Party of Denmark | 67 | 0.48 | +0.15 | |||
| Total | 14,101 | |||||
| Source[41] | ||||||
General elections in the 1920s
1929 Danish Folketing election
| Parties | Vote | |||||
|---|---|---|---|---|---|---|
| Votes | % | + / - | ||||
| Social Democrats | 4,342 | 32.22 | +3.33 | |||
| Venstre | 3,816 | 28.32 | -1.80 | |||
| Social Liberals | 3,750 | 27.83 | -0.14 | |||
| Conservatives | 1,275 | 9.46 | -2.64 | |||
| Justice Party of Denmark | 248 | 1.84 | +0.92 | |||
| Communist Party of Denmark | 44 | 0.33 | New | |||
| Total | 13,475 | |||||
| Source[42] | ||||||
1926 Danish Folketing election
| Parties | Vote | |||||
|---|---|---|---|---|---|---|
| Votes | % | + / - | ||||
| Venstre | 3,768 | 30.12 | +9.92 | |||
| Social Democrats | 3,614 | 28.89 | +10.18 | |||
| Social Liberals | 3,499 | 27.97 | -23.12 | |||
| Conservatives | 1,514 | 12.10 | +3.65 | |||
| Justice Party of Denmark | 115 | 0.92 | +0.08 | |||
| Total | 12,510 | |||||
| Source[43] | ||||||
1924 Danish Folketing election
| Parties | Vote | |||||
|---|---|---|---|---|---|---|
| Votes | % | + / - | ||||
| Social Liberals | 8,849 | 51.09 | +20.75 | |||
| Venstre | 3,498 | 20.20 | -12.83 | |||
| Social Democrats | 3,240 | 18.71 | -5.31 | |||
| Conservatives | 1,464 | 8.45 | -3.77 | |||
| Justice Party of Denmark | 145 | 0.84 | New | |||
| Farmer Party | 75 | 0.43 | New | |||
| Communist Party of Denmark | 48 | 0.28 | New | |||
| Total | 17,319 | |||||
| Source[44] | ||||||
September 1920 Danish Folketing election
| Parties | Vote | |||||
|---|---|---|---|---|---|---|
| Votes | % | + / - | ||||
| Venstre | 3,940 | 33.03 | -2.40 | |||
| Social Liberals | 3,619 | 30.34 | +1.81 | |||
| Social Democrats | 2,865 | 24.02 | +1.02 | |||
| Conservatives | 1,458 | 12.22 | -0.26 | |||
| Industry Party | 48 | 0.40 | -0.17 | |||
| Total | 11,930 | |||||
| Source[45] | ||||||
July 1920 Danish Folketing election
| Parties | Vote | |||||
|---|---|---|---|---|---|---|
| Votes | % | + / - | ||||
| Venstre | 3,537 | 35.43 | +0.02 | |||
| Social Liberals | 2,848 | 28.53 | -2.89 | |||
| Social Democrats | 2,296 | 23.00 | +2.20 | |||
| Conservatives | 1,246 | 12.48 | +0.67 | |||
| Industry Party | 57 | 0.57 | +0.02 | |||
| Total | 9,984 | |||||
| Source[46] | ||||||
April 1920 Danish Folketing election
| Parties | Vote | |||||
|---|---|---|---|---|---|---|
| Votes | % | |||||
| Venstre | 3,621 | 35.41 | ||||
| Social Liberals | 3,213 | 31.42 | ||||
| Social Democrats | 2,127 | 20.80 | ||||
| Conservatives | 1,208 | 11.81 | ||||
| Industry Party | 56 | 0.55 | ||||
| Total | 10,225 | |||||
| Source[47] | ||||||
European Parliament elections results
2019 European Parliament election in Denmark
| Parties | Vote | |||||
|---|---|---|---|---|---|---|
| Votes | % | + / - | ||||
| Social Democrats | 7,815 | 23.42 | +5.16 | |||
| Venstre | 7,496 | 22.47 | +4.73 | |||
| Danish People's Party | 4,387 | 13.15 | -15.89 | |||
| Green Left | 3,959 | 11.87 | +1.73 | |||
| Social Liberals | 2,982 | 8.94 | +2.68 | |||
| Red–Green Alliance | 1,981 | 5.94 | New | |||
| Conservatives | 1,664 | 4.99 | -1.93 | |||
| People's Movement against the EU | 1,525 | 4.57 | -4.67 | |||
| The Alternative | 894 | 2.68 | New | |||
| Liberal Alliance | 660 | 1.98 | -0.43 | |||
| Total | 33,363 | |||||
| Source[48] | ||||||
2014 European Parliament election in Denmark
| Parties | Vote | |||||
|---|---|---|---|---|---|---|
| Votes | % | + / - | ||||
| Danish People's Party | 7,898 | 29.04 | +12.41 | |||
| Social Democrats | 4,966 | 18.26 | -1.81 | |||
| Venstre | 4,824 | 17.74 | -2.43 | |||
| Green Left | 2,759 | 10.14 | -6.91 | |||
| People's Movement against the EU | 2,512 | 9.24 | +1.95 | |||
| Conservatives | 1,881 | 6.92 | -4.57 | |||
| Social Liberals | 1,703 | 6.26 | +1.71 | |||
| Liberal Alliance | 656 | 2.41 | +1.99 | |||
| Total | 27,199 | |||||
| Source[49] | ||||||
2009 European Parliament election in Denmark
| Parties | Vote | |||||
|---|---|---|---|---|---|---|
| Votes | % | + / - | ||||
| Venstre | 5,836 | 20.17 | +2.73 | |||
| Social Democrats | 5,808 | 20.07 | -11.43 | |||
| Green Left | 4,933 | 17.05 | +8.17 | |||
| Danish People's Party | 4,812 | 16.63 | +9.81 | |||
| Conservatives | 3,326 | 11.49 | +0.80 | |||
| People's Movement against the EU | 2,110 | 7.29 | +2.74 | |||
| Social Liberals | 1,317 | 4.55 | -4.61 | |||
| June Movement | 676 | 2.34 | -7.91 | |||
| Liberal Alliance | 122 | 0.42 | New | |||
| Total | 28,940 | |||||
| Source[50] | ||||||
2004 European Parliament election in Denmark
| Parties | Vote | |||||
|---|---|---|---|---|---|---|
| Votes | % | + / - | ||||
| Social Democrats | 6,342 | 31.50 | +15.12 | |||
| Venstre | 3,511 | 17.44 | -2.31 | |||
| Conservatives | 2,153 | 10.69 | +0.54 | |||
| June Movement | 2,064 | 10.25 | -7.19 | |||
| Social Liberals | 1,844 | 9.16 | -1.70 | |||
| Green Left | 1,787 | 8.88 | +1.81 | |||
| Danish People's Party | 1,374 | 6.82 | +1.61 | |||
| People's Movement against the EU | 916 | 4.55 | -3.41 | |||
| Christian Democrats | 143 | 0.71 | -0.80 | |||
| Total | 20,134 | |||||
| Source[51] | ||||||
1999 European Parliament election in Denmark
| Parties | Vote | |||||
|---|---|---|---|---|---|---|
| Votes | % | + / - | ||||
| Venstre | 4,105 | 19.75 | +2.56 | |||
| June Movement | 3,625 | 17.44 | +0.91 | |||
| Social Democrats | 3,406 | 16.38 | +2.21 | |||
| Social Liberals | 2,258 | 10.86 | -2.55 | |||
| Conservatives | 2,110 | 10.15 | -6.76 | |||
| People's Movement against the EU | 1,655 | 7.96 | -2.12 | |||
| Green Left | 1,470 | 7.07 | -1.08 | |||
| Danish People's Party | 1,084 | 5.21 | New | |||
| Centre Democrats | 763 | 3.67 | +2.80 | |||
| Christian Democrats | 314 | 1.51 | +0.83 | |||
| Progress Party | 104 | 0.50 | -1.51 | |||
| Total | 20,790 | |||||
| Source[52] | ||||||
1994 European Parliament election in Denmark
| Parties | Vote | |||||
|---|---|---|---|---|---|---|
| Votes | % | + / - | ||||
| Venstre | 3,812 | 17.19 | +1.09 | |||
| Conservatives | 3,750 | 16.91 | +4.44 | |||
| June Movement | 3,665 | 16.53 | New | |||
| Social Democrats | 3,141 | 14.17 | -8.35 | |||
| Social Liberals | 2,973 | 13.41 | +7.67 | |||
| People's Movement against the EU | 2,235 | 10.08 | -9.16 | |||
| Green Left | 1,806 | 8.15 | -1.02 | |||
| Progress Party | 446 | 2.01 | -2.66 | |||
| Centre Democrats | 193 | 0.87 | -7.40 | |||
| Christian Democrats | 151 | 0.68 | -1.14 | |||
| Total | 22,172 | |||||
| Source[53] | ||||||
1989 European Parliament election in Denmark
| Parties | Vote | |||||
|---|---|---|---|---|---|---|
| Votes | % | + / - | ||||
| Social Democrats | 4,171 | 22.52 | +3.34 | |||
| People's Movement against the EU | 3,564 | 19.24 | -2.10 | |||
| Venstre | 2,982 | 16.10 | +3.37 | |||
| Conservatives | 2,309 | 12.47 | -6.14 | |||
| Green Left | 1,699 | 9.17 | +0.23 | |||
| Centre Democrats | 1,531 | 8.27 | +1.48 | |||
| Social Liberals | 1,063 | 5.74 | -0.35 | |||
| Progress Party | 865 | 4.67 | +1.54 | |||
| Christian Democrats | 338 | 1.82 | -0.29 | |||
| Total | 18,522 | |||||
| Source[54] | ||||||
1984 European Parliament election in Denmark
| Parties | Vote | |||||
|---|---|---|---|---|---|---|
| Votes | % | |||||
| People's Movement against the EU | 4,191 | 21.34 | ||||
| Social Democrats | 3,766 | 19.18 | ||||
| Conservatives | 3,654 | 18.61 | ||||
| Venstre | 2,500 | 12.73 | ||||
| Green Left | 1,755 | 8.94 | ||||
| Centre Democrats | 1,333 | 6.79 | ||||
| Social Liberals | 1,196 | 6.09 | ||||
| Progress Party | 615 | 3.13 | ||||
| Christian Democrats | 414 | 2.11 | ||||
| Left Socialists | 211 | 1.07 | ||||
| Total | 19,635 | |||||
| Source[55] | ||||||
Referendums
2022 Danish European Union opt-out referendum[56]
| Option | Votes | % |
|---|---|---|
| ✓ YES | 22,771 | 64.19 |
| X NO | 12,704 | 35.81 |
2015 Danish European Union opt-out referendum[57]
| Option | Votes | % |
|---|---|---|
| X NO | 20,724 | 56.70 |
| ✓ YES | 15,825 | 43.30 |
2014 Danish Unified Patent Court membership referendum[58]
| Option | Votes | % |
|---|---|---|
| ✓ YES | 16,456 | 64.09 |
| X NO | 9,219 | 35.91 |
2009 Danish Act of Succession referendum[59]
| Option | Votes | % |
|---|---|---|
| ✓ YES | 23,426 | 85.37 |
| X NO | 4,014 | 14.63 |
2000 Danish euro referendum[60]
| Option | Votes | % |
|---|---|---|
| X NO | 21,433 | 56.92 |
| ✓ YES | 16,221 | 43.08 |
1998 Danish Amsterdam Treaty referendum[61]
| Option | Votes | % |
|---|---|---|
| ✓ YES | 16,944 | 52.43 |
| X NO | 15,372 | 47.57 |
1993 Danish Maastricht Treaty referendum[62]
| Option | Votes | % |
|---|---|---|
| ✓ YES | 19,855 | 55.08 |
| X NO | 16,194 | 44.92 |
1992 Danish Maastricht Treaty referendum[63]
| Option | Votes | % |
|---|---|---|
| X NO | 18,093 | 52.03 |
| ✓ YES | 16,681 | 47.97 |
1986 Danish Single European Act referendum[64]
| Option | Votes | % |
|---|---|---|
| ✓ YES | 16,867 | 56.16 |
| X NO | 13,169 | 43.84 |
1972 Danish European Communities membership referendum[65]
| Option | Votes | % |
|---|---|---|
| ✓ YES | 18,538 | 63.58 |
| X NO | 10,617 | 36.42 |
1953 Danish constitutional and electoral age referendum[66]
| Option | Votes | % |
|---|---|---|
| ✓ YES | 12,335 | 88.42 |
| X NO | 1,616 | 11.58 |
| 21 years | 7,510 | 52.16 |
| 23 years | 6,889 | 47.84 |
1939 Danish constitutional referendum[67]
| Option | Votes | % |
|---|---|---|
| ✓ YES | 9,825 | 93.54 |
| X NO | 679 | 6.46 |
References
- ↑ "Holbækkredsen". kmdvalg.dk (in Danish). Retrieved 2023-06-05.
- ↑ "Beretning om Forhandlingerne paa Rigsdagen". Rigsdagstidende. II: Spalte 3892 ff.
- ↑ "Nye valgkredse fordeler stemmerne anderledes". dr.dk (in Danish). Retrieved 2023-06-05.
- ↑ "Beretning om nye valgkredse som følge af kommunalreformen" (in Danish). Retrieved 2023-06-05.
- ↑ "Det danske valgsystem: Valg til Folketinget". valg.im (in Danish). Retrieved 2023-06-05.
- ↑ "37 Holbæk". dataforsyningen.dk (in Danish). Retrieved 2023-06-05.
- ↑ "Beretning om Forhandlingerne paa Rigsdagen". Rigsdagstidende. II: Spalte 3892 ff.
- ↑ "Valgresultater fra tidligere valg:". kmdvalg (in Danish). Retrieved 2023-06-05.
- ↑ "FOLKETINGSVALG TIRSDAG 1. NOVEMBER 2022". valg.im (in Danish). Retrieved 2023-06-27.
- ↑ "FOLKETINGSVALG ONSDAG 5. JUNI 2019". valg.im (in Danish). Retrieved 2023-06-27.
- ↑ "FOLKETINGSVALG TORSDAG 18. JUNI 2015". valg.im (in Danish). Retrieved 2023-06-27.
- ↑ "FOLKETINGSVALG TORSDAG 15. SEPTEMBER 2011". valg.im (in Danish). Retrieved 2023-06-27.
- ↑ "Folketingsvalget den 13. november 2007". valg.im (in Danish). Retrieved 2023-06-27.
- ↑ "valg2005.book" (PDF). valg.im (in Danish). Retrieved 2023-06-27.
- ↑ "BMTABEL" (PDF). valg.im (in Danish). Retrieved 2023-06-27.
- ↑ "VALG98" (PDF). valg.im (in Danish). Retrieved 2023-06-27.
- ↑ "VALG94" (PDF). valg.im (in Danish). Retrieved 2023-06-27.
- ↑ "VALG90" (PDF). valg.im (in Danish). Retrieved 2023-06-27.
- ↑ "Folketingsvalget den 10. maj 1988". valg.im (in Danish). Retrieved 2023-06-27.
- ↑ "Folketingsvalget den 8.september 1987". dst.dk (in Danish). Retrieved 2023-06-27.
- ↑ "Folketingsvalget den 10. januar 1984". dst.dk (in Danish). Retrieved 2023-06-27.
- ↑ "Folketingsvalget den 8. december 1981". dst.dk (in Danish). Retrieved 2023-06-27.
- ↑ "Folketingsvalget den 23. oktober 1979". dst.dk (in Danish). Retrieved 2023-06-27.
- ↑ "Folketingsvalget den 15. februar 1977". dst.dk (in Danish). Retrieved 2023-06-27.
- ↑ "Folketingsvalget den 9. januar 1975". dst.dk (in Danish). Retrieved 2023-06-27.
- ↑ "Folketingsvalget den 4. december 1973". dst.dk (in Danish). Retrieved 2023-06-27.
- ↑ "Folketingsvalget den 21. september 1971 samt folkeafstemningen". dst.dk (in Danish). Retrieved 2023-06-27.
- ↑ "Folketingsvalget den 23. januar 1968". dst.dk (in Danish). Retrieved 2023-06-27.
- ↑ "Folketingsvalget den 22. november 1966". dst.dk (in Danish). Retrieved 2023-06-27.
- ↑ "Folketingsvalget den 22. september 1964". dst.dk (in Danish). Retrieved 2023-06-27.
- ↑ "Folketingsvalget den 15. november 1960". dst.dk (in Danish). Retrieved 2023-06-27.
- ↑ "Folketingsvalget den 14. maj 1957". dst.dk (in Danish). Retrieved 2023-06-27.
- ↑ "Folketingsvalget den 22. september 1953". dst.dk (in Danish). Retrieved 2023-06-27.
- ↑ "Rigsdagsvalgene og folkeafstemningerne i april og maj 1953". dst.dk (in Danish). Retrieved 2023-06-27.
- ↑ "Folketingsvalget den 5. september 1950". dst.dk (in Danish). Retrieved 2023-06-27.
- ↑ "Folketingsvalget den 28. oktober 1947". dst.dk (in Danish). Retrieved 2023-06-27.
- ↑ "Rigsdagsvalgene i oktober og november 1945". dst.dk (in Danish). Retrieved 2023-06-27.
- ↑ "Rigsdagsvalgene i marts og april 1943". dst.dk (in Danish). Retrieved 2023-06-27.
- ↑ "Rigsdagsvalgene og Folkeafstemningen i april og maj 1939". dst.dk (in Danish). Retrieved 2023-06-27.
- ↑ "Folketingsvalget den 22. oktober 1935". dst.dk (in Danish). Retrieved 2023-06-27.
- ↑ "Folketingsvalget den 16. november 1932". dst.dk (in Danish). Retrieved 2023-06-27.
- ↑ "Folketingsvalget den 24. april 1929". dst.dk (in Danish). Retrieved 2023-06-27.
- ↑ "Folketingsvalget den 2. december 1926". dst.dk (in Danish). Retrieved 2023-06-27.
- ↑ "Folketingsvalget den 11. april 1924". dst.dk (in Danish). Retrieved 2023-06-27.
- ↑ "Rigsdagsvalgene september-oktober 1920". dst.dk (in Danish). Retrieved 2023-06-27.
- ↑ "Rigsdagsvalgene juli-august 1920". dst.dk (in Danish). Retrieved 2023-06-27.
- ↑ "Folketingsvalget den 26. april 1920". dst.dk (in Danish). Retrieved 2023-06-27.
- ↑ "EUROPA-PARLAMENTSVALG SØNDAG 26. MAJ 2019". dst.dk (in Danish). Retrieved 2023-07-01.
- ↑ "EUROPA-PARLAMENTSVALG SØNDAG 25. MAJ 2014". dst.dk (in Danish). Retrieved 2023-07-01.
- ↑ "EUROPA-PARLAMENTSVALG SØNDAG 7. JUNI 2009". dst.dk (in Danish). Retrieved 2023-07-01.
- ↑ "EUROPA-PARLAMENTSVALGET DEN 13. JUNI 2004" (PDF). im.dk (in Danish). Retrieved 2023-07-01.
- ↑ "VALGET TIL EUROPA-PARLAMENTET DEN 10. JUNI 1999" (PDF). im.dk (in Danish). Retrieved 2023-07-01.
- ↑ "VALGET TIL EUROPA-PARLAMENTET DEN 9. JUNI 1994" (PDF). im.dk (in Danish). Retrieved 2023-07-01.
- ↑ "Valget til Europa-parlamentet den 15. juni 1989". dst.dk (in Danish). Retrieved 2023-07-01.
- ↑ "Valget til Europa-Parlamentet den 14. juni 1984". dst.dk (in Danish). Retrieved 2023-07-01.
- ↑ "FOLKEAFSTEMNING ONSDAG 1. JUNI 2022". dst.dk (in Danish). Retrieved 2023-07-05.
- ↑ "FOLKEAFSTEMNING TORSDAG 3. DECEMBER 2015". dst.dk (in Danish). Retrieved 2023-07-05.
- ↑ "FOLKEAFSTEMNING SØNDAG 25. MAJ 2014". dst.dk (in Danish). Retrieved 2023-07-05.
- ↑ "FOLKEAFSTEMNING SØNDAG 7. JUNI 2009". dst.dk (in Danish). Retrieved 2023-07-05.
- ↑ "FOLKEAFSTEMNINGEN DEN 28. SEPTEMBER 2000 OM DANMARKS DELTAGELSE I DEN FÆLLES VALUTA" (PDF). valg.im (in Danish). Retrieved 2023-07-05.
- ↑ "FOLKEAFSTEMNINGEN DEN 28. MAJ 1998OM DANMARKS TILTRÆDELSE AF AMSTERDAMTRAKTATEN" (PDF). valg.im (in Danish). Retrieved 2023-07-05.
- ↑ "FOLKEAFSTEMNINGEN DEN 18. MAJ 1993 OM DANMARKS TILTRÆDELSE AF EDINBURGH-AFGØRELSEN OG MAASTRICHT-TRAKTATEN". dst.dk (in Danish). Retrieved 2023-07-05.
- ↑ "Folkeafstemningen den 1. juni 1992 om Danmarks tiltrædelse af traktaten om Den Europæiske Union". dst.dk (in Danish). Retrieved 2023-07-05.
- ↑ "Vejledende folkeafstemning torsdag den 27. februar 1986 om Danmarks tiltrædelse af EF- pakken". dst.dk (in Danish). Retrieved 2023-07-05.
- ↑ "Folkeafstemningen om Danmarks tiltrædelse af De europæiske Fælleskaber 2. oktober 1972". dst.dk (in Danish). Retrieved 2023-07-05.
- ↑ "Publikationsfortegnelse vedrørende Folkeafstemninger". dst.dk (in Danish). Retrieved 2023-07-05.
- ↑ "Publikationsfortegnelse vedrørende Folkeafstemninger". dst.dk (in Danish). Retrieved 2023-07-05.