| Holstebro | |
|---|---|
| Holstebro | |
| Nomination district constituency for the Folketing | |
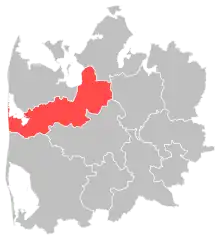 Location of Holstebro within West Jutland | |
 Location of West Jutland within Denmark | |
| Municipalities | Holstebro |
| Constituency | West Jutland |
| Electorate | 43,147 (2022)[1] |
| Current constituency | |
| Created | 1849 (as constituency)[2] 1920 (as nomination district) |
Holstebro nominating district is one of the 92 nominating districts that exists for Danish elections following the 2007 municipal reform.[3][4][5] It consists of Holstebro Municipality.[6] It was created in 1849[7] as a constituency, and has been a nomination district since 1920, though its boundaries have been changed since then.
In general elections, the district is a strong area for parties commonly associated with the blue bloc.[8]
General elections results
General elections in the 2020s
| Parties | Vote | |||||
|---|---|---|---|---|---|---|
| Votes | % | + / - | ||||
| Social Democrats | 9,740 | 26.77 | -1.01 | |||
| Venstre | 8,916 | 24.51 | -6.14 | |||
| Denmark Democrats | 4,497 | 12.36 | New | |||
| Liberal Alliance | 2,990 | 8.22 | +5.75 | |||
| Green Left | 2,399 | 6.59 | -0.08 | |||
| Conservatives | 1,884 | 5.18 | -1.43 | |||
| Moderates | 1,884 | 5.18 | New | |||
| New Right | 940 | 2.58 | +1.05 | |||
| Danish People's Party | 783 | 2.15 | -5.87 | |||
| Red–Green Alliance | 740 | 2.03 | -1.40 | |||
| Social Liberals | 624 | 1.72 | -3.28 | |||
| Christian Democrats | 446 | 1.23 | -3.19 | |||
| The Alternative | 387 | 1.06 | -0.33 | |||
| Independent Greens | 119 | 0.33 | New | |||
| Karen Predbjørn Klarbæk | 35 | 0.10 | New | |||
| Total | 36,384 | |||||
| Source[9] | ||||||
General elections in the 2010s
| Parties | Vote | |||||
|---|---|---|---|---|---|---|
| Votes | % | + / - | ||||
| Venstre | 11,251 | 30.65 | +4.40 | |||
| Social Democrats | 10,196 | 27.78 | -1.52 | |||
| Danish People's Party | 2,945 | 8.02 | -12.57 | |||
| Green Left | 2,447 | 6.67 | +3.14 | |||
| Conservatives | 2,427 | 6.61 | +3.12 | |||
| Social Liberals | 1,836 | 5.00 | +2.23 | |||
| Christian Democrats | 1,623 | 4.42 | +2.46 | |||
| Red–Green Alliance | 1,259 | 3.43 | -0.64 | |||
| Liberal Alliance | 907 | 2.47 | -3.27 | |||
| New Right | 563 | 1.53 | New | |||
| Stram Kurs | 541 | 1.47 | New | |||
| The Alternative | 512 | 1.39 | -0.79 | |||
| Klaus Riskær Pedersen Party | 197 | 0.54 | New | |||
| Total | 36,704 | |||||
| Source[10] | ||||||
| Parties | Vote | |||||
|---|---|---|---|---|---|---|
| Votes | % | + / - | ||||
| Social Democrats | 10,762 | 29.30 | +5.07 | |||
| Venstre | 9,642 | 26.25 | -3.42 | |||
| Danish People's Party | 7,563 | 20.59 | +9.51 | |||
| Liberal Alliance | 2,107 | 5.74 | +0.41 | |||
| Red–Green Alliance | 1,496 | 4.07 | +0.56 | |||
| Green Left | 1,296 | 3.53 | -5.24 | |||
| Conservatives | 1,281 | 3.49 | -0.30 | |||
| Social Liberals | 1,017 | 2.77 | -4.02 | |||
| The Alternative | 799 | 2.18 | New | |||
| Christian Democrats | 720 | 1.96 | -4.81 | |||
| Erik Sputnik | 44 | 0.12 | New | |||
| Total | 36,727 | |||||
| Source[11] | ||||||
| Parties | Vote | |||||
|---|---|---|---|---|---|---|
| Votes | % | + / - | ||||
| Venstre | 10,991 | 29.67 | -10.16 | |||
| Social Democrats | 8,977 | 24.23 | -0.14 | |||
| Danish People's Party | 4,105 | 11.08 | -0.20 | |||
| Green Left | 3,250 | 8.77 | -1.49 | |||
| Social Liberals | 2,516 | 6.79 | +2.99 | |||
| Christian Democrats | 2,510 | 6.77 | +4.11 | |||
| Liberal Alliance | 1,975 | 5.33 | +3.78 | |||
| Conservatives | 1,405 | 3.79 | -1.66 | |||
| Red–Green Alliance | 1,302 | 3.51 | +2.73 | |||
| Rikke Cramer Christiansen | 16 | 0.04 | New | |||
| Ejgil Kølbæk | 3 | 0.01 | -0.01 | |||
| Total | 37,050 | |||||
| Source[12] | ||||||
General elections in the 2000s
| Parties | Vote | |||||
|---|---|---|---|---|---|---|
| Votes | % | + / - | ||||
| Venstre | 14,553 | 39.83 | -0.84 | |||
| Social Democrats | 8,906 | 24.37 | +0.86 | |||
| Danish People's Party | 4,122 | 11.28 | -0.04 | |||
| Green Left | 3,749 | 10.26 | +4.93 | |||
| Conservatives | 1,992 | 5.45 | -0.82 | |||
| Social Liberals | 1,390 | 3.80 | -2.59 | |||
| Christian Democrats | 972 | 2.66 | -1.40 | |||
| New Alliance | 565 | 1.55 | New | |||
| Red–Green Alliance | 284 | 0.78 | -0.65 | |||
| Ejgil Kølbæk | 9 | 0.02 | 0.00 | |||
| Total | 36,542 | |||||
| Source[13] | ||||||
| Parties | Vote | |||||
|---|---|---|---|---|---|---|
| Votes | % | + / - | ||||
| Venstre | 20,355 | 40.67 | +1.37 | |||
| Social Democrats | 11,768 | 23.51 | -3.44 | |||
| Danish People's Party | 5,665 | 11.32 | +0.40 | |||
| Social Liberals | 3,199 | 6.39 | +2.45 | |||
| Conservatives | 3,138 | 6.27 | -0.29 | |||
| Green Left | 2,669 | 5.33 | +0.44 | |||
| Christian Democrats | 2,032 | 4.06 | -0.63 | |||
| Red–Green Alliance | 715 | 1.43 | +0.66 | |||
| Centre Democrats | 446 | 0.89 | -0.36 | |||
| Minority Party | 55 | 0.11 | New | |||
| Ejgil Kølbæk | 10 | 0.02 | New | |||
| Total | 50,052 | |||||
| Source[14] | ||||||
| Parties | Vote | |||||
|---|---|---|---|---|---|---|
| Votes | % | + / - | ||||
| Venstre | 20,207 | 39.30 | +9.44 | |||
| Social Democrats | 13,857 | 26.95 | -7.15 | |||
| Danish People's Party | 5,614 | 10.92 | +3.87 | |||
| Conservatives | 3,375 | 6.56 | -0.52 | |||
| Green Left | 2,516 | 4.89 | -1.23 | |||
| Christian People's Party | 2,411 | 4.69 | -1.85 | |||
| Social Liberals | 2,027 | 3.94 | +1.39 | |||
| Centre Democrats | 641 | 1.25 | -2.45 | |||
| Red–Green Alliance | 398 | 0.77 | -0.18 | |||
| Progress Party | 373 | 0.73 | -1.09 | |||
| Total | 51,419 | |||||
| Source[15] | ||||||
General elections in the 1990s
| Parties | Vote | |||||
|---|---|---|---|---|---|---|
| Votes | % | + / - | ||||
| Social Democrats | 17,284 | 34.10 | +0.81 | |||
| Venstre | 15,134 | 29.86 | -0.04 | |||
| Conservatives | 3,587 | 7.08 | -7.16 | |||
| Danish People's Party | 3,574 | 7.05 | New | |||
| Christian People's Party | 3,316 | 6.54 | +2.50 | |||
| Green Left | 3,101 | 6.12 | +1.03 | |||
| Centre Democrats | 1,873 | 3.70 | +1.29 | |||
| Social Liberals | 1,295 | 2.55 | -0.47 | |||
| Progress Party | 925 | 1.82 | -4.97 | |||
| Red–Green Alliance | 481 | 0.95 | -0.28 | |||
| Democratic Renewal | 118 | 0.23 | New | |||
| Total | 50,688 | |||||
| Source[16] | ||||||
| Parties | Vote | |||||
|---|---|---|---|---|---|---|
| Votes | % | + / - | ||||
| Social Democrats | 16,466 | 33.29 | -0.36 | |||
| Venstre | 14,787 | 29.90 | +9.27 | |||
| Conservatives | 7,042 | 14.24 | -0.05 | |||
| Progress Party | 3,358 | 6.79 | -2.33 | |||
| Green Left | 2,515 | 5.09 | -0.34 | |||
| Christian People's Party | 1,998 | 4.04 | -1.45 | |||
| Social Liberals | 1,493 | 3.02 | +0.34 | |||
| Centre Democrats | 1,193 | 2.41 | -3.90 | |||
| Red–Green Alliance | 606 | 1.23 | +0.77 | |||
| Total | 49,458 | |||||
| Source[17] | ||||||
| Parties | Vote | |||||
|---|---|---|---|---|---|---|
| Votes | % | + / - | ||||
| Social Democrats | 16,160 | 33.65 | +7.10 | |||
| Venstre | 9,909 | 20.63 | +2.56 | |||
| Conservatives | 6,860 | 14.29 | -1.67 | |||
| Progress Party | 4,379 | 9.12 | -1.65 | |||
| Centre Democrats | 3,029 | 6.31 | -2.27 | |||
| Christian People's Party | 2,638 | 5.49 | +0.61 | |||
| Green Left | 2,609 | 5.43 | -2.64 | |||
| Social Liberals | 1,286 | 2.68 | -1.77 | |||
| Common Course | 510 | 1.06 | -0.20 | |||
| Red–Green Alliance | 222 | 0.46 | New | |||
| The Greens | 220 | 0.46 | -0.35 | |||
| Justice Party of Denmark | 200 | 0.42 | New | |||
| Total | 48,022 | |||||
| Source[18] | ||||||
General elections in the 1980s
| Parties | Vote | |||||
|---|---|---|---|---|---|---|
| Votes | % | + / - | ||||
| Social Democrats | 13,100 | 26.55 | -0.43 | |||
| Venstre | 8,918 | 18.07 | +1.36 | |||
| Conservatives | 7,878 | 15.96 | -2.11 | |||
| Progress Party | 5,313 | 10.77 | +4.90 | |||
| Centre Democrats | 4,232 | 8.58 | -0.26 | |||
| Green Left | 3,982 | 8.07 | -1.22 | |||
| Christian People's Party | 2,407 | 4.88 | -0.62 | |||
| Social Liberals | 2,197 | 4.45 | -0.45 | |||
| Common Course | 624 | 1.26 | -0.26 | |||
| The Greens | 398 | 0.81 | -0.03 | |||
| Communist Party of Denmark | 197 | 0.40 | +0.39 | |||
| Left Socialists | 78 | 0.16 | -0.26 | |||
| Kaj Ove Sørensen | 22 | 0.04 | New | |||
| Total | 49,346 | |||||
| Source[19] | ||||||
| Parties | Vote | |||||
|---|---|---|---|---|---|---|
| Votes | % | + / - | ||||
| Social Democrats | 13,341 | 26.98 | -0.55 | |||
| Conservatives | 8,936 | 18.07 | -3.17 | |||
| Venstre | 8,261 | 16.71 | -2.12 | |||
| Green Left | 4,595 | 9.29 | +1.97 | |||
| Centre Democrats | 4,373 | 8.84 | +2.09 | |||
| Progress Party | 2,902 | 5.87 | +1.11 | |||
| Christian People's Party | 2,721 | 5.50 | -1.24 | |||
| Social Liberals | 2,421 | 4.90 | +0.58 | |||
| Common Course | 754 | 1.52 | New | |||
| The Greens | 415 | 0.84 | New | |||
| Justice Party of Denmark | 228 | 0.46 | -0.79 | |||
| Socialist Workers Party | 223 | 0.45 | +0.44 | |||
| Left Socialists | 206 | 0.42 | -0.42 | |||
| Humanist Party | 60 | 0.12 | New | |||
| Ian Jordan | 4 | 0.01 | New | |||
| Communist Party of Denmark | 3 | 0.01 | -0.37 | |||
| Marxist–Leninists Party | 3 | 0.01 | 0.00 | |||
| Erik Haaest | 2 | 0.00 | New | |||
| Total | 49,448 | |||||
| Source[20] | ||||||
| Parties | Vote | |||||
|---|---|---|---|---|---|---|
| Votes | % | + / - | ||||
| Social Democrats | 13,567 | 27.53 | -1.73 | |||
| Conservatives | 10,466 | 21.24 | +9.48 | |||
| Venstre | 9,278 | 18.83 | +0.99 | |||
| Green Left | 3,608 | 7.32 | +0.24 | |||
| Centre Democrats | 3,324 | 6.75 | -3.09 | |||
| Christian People's Party | 3,323 | 6.74 | +0.97 | |||
| Progress Party | 2,344 | 4.76 | -6.96 | |||
| Social Liberals | 2,131 | 4.32 | +0.19 | |||
| Justice Party of Denmark | 616 | 1.25 | +0.07 | |||
| Left Socialists | 416 | 0.84 | +0.04 | |||
| Communist Party of Denmark | 188 | 0.38 | -0.15 | |||
| Marxist–Leninists Party | 7 | 0.01 | New | |||
| Socialist Workers Party | 4 | 0.01 | -0.01 | |||
| Total | 49,272 | |||||
| Source[21] | ||||||
| Parties | Vote | |||||
|---|---|---|---|---|---|---|
| Votes | % | + / - | ||||
| Social Democrats | 13,395 | 29.26 | -4.02 | |||
| Venstre | 8,166 | 17.84 | -1.41 | |||
| Conservatives | 5,383 | 11.76 | +0.67 | |||
| Progress Party | 5,365 | 11.72 | -0.82 | |||
| Centre Democrats | 4,505 | 9.84 | +6.05 | |||
| Green Left | 3,240 | 7.08 | +3.52 | |||
| Christian People's Party | 2,641 | 5.77 | -0.44 | |||
| Social Liberals | 1,891 | 4.13 | -1.14 | |||
| Justice Party of Denmark | 540 | 1.18 | -1.03 | |||
| Left Socialists | 365 | 0.80 | -0.88 | |||
| Communist Party of Denmark | 244 | 0.53 | -0.31 | |||
| Communist Workers Party | 36 | 0.08 | -0.19 | |||
| Socialist Workers Party | 7 | 0.02 | New | |||
| Total | 45,778 | |||||
| Source[22] | ||||||
General elections in the 1970s
| Parties | Vote | |||||
|---|---|---|---|---|---|---|
| Votes | % | + / - | ||||
| Social Democrats | 15,314 | 33.28 | +3.21 | |||
| Venstre | 8,859 | 19.25 | -0.73 | |||
| Progress Party | 5,769 | 12.54 | -4.35 | |||
| Conservatives | 5,103 | 11.09 | +3.63 | |||
| Christian People's Party | 2,857 | 6.21 | -1.14 | |||
| Social Liberals | 2,423 | 5.27 | +1.65 | |||
| Centre Democrats | 1,745 | 3.79 | -2.31 | |||
| Green Left | 1,640 | 3.56 | +1.53 | |||
| Justice Party of Denmark | 1,019 | 2.21 | -0.67 | |||
| Left Socialists | 771 | 1.68 | +0.32 | |||
| Communist Party of Denmark | 385 | 0.84 | -0.92 | |||
| Communist Workers Party | 125 | 0.27 | New | |||
| Total | 46,010 | |||||
| Source[23] | ||||||
| Parties | Vote | |||||
|---|---|---|---|---|---|---|
| Votes | % | + / - | ||||
| Social Democrats | 13,180 | 30.07 | +6.05 | |||
| Venstre | 8,757 | 19.98 | -11.70 | |||
| Progress Party | 7,403 | 16.89 | +2.06 | |||
| Conservatives | 3,272 | 7.46 | +3.47 | |||
| Christian People's Party | 3,222 | 7.35 | -2.22 | |||
| Centre Democrats | 2,675 | 6.10 | +3.39 | |||
| Social Liberals | 1,587 | 3.62 | -2.81 | |||
| Justice Party of Denmark | 1,264 | 2.88 | +1.23 | |||
| Green Left | 891 | 2.03 | -0.29 | |||
| Communist Party of Denmark | 772 | 1.76 | -0.02 | |||
| Left Socialists | 596 | 1.36 | +0.35 | |||
| Pensioners' Party | 217 | 0.50 | New | |||
| Total | 43,836 | |||||
| Source[24] | ||||||
| Parties | Vote | |||||
|---|---|---|---|---|---|---|
| Votes | % | + / - | ||||
| Venstre | 13,622 | 31.68 | +13.35 | |||
| Social Democrats | 10,326 | 24.02 | +4.09 | |||
| Progress Party | 6,377 | 14.83 | -3.28 | |||
| Christian People's Party | 4,115 | 9.57 | +0.82 | |||
| Social Liberals | 2,765 | 6.43 | -6.45 | |||
| Conservatives | 1,717 | 3.99 | -3.60 | |||
| Centre Democrats | 1,164 | 2.71 | -3.87 | |||
| Green Left | 998 | 2.32 | -0.52 | |||
| Communist Party of Denmark | 766 | 1.78 | +0.36 | |||
| Justice Party of Denmark | 711 | 1.65 | -1.17 | |||
| Left Socialists | 436 | 1.01 | +0.26 | |||
| Total | 42,997 | |||||
| Source[25] | ||||||
| Parties | Vote | |||||
|---|---|---|---|---|---|---|
| Votes | % | + / - | ||||
| Social Democrats | 8,413 | 19.93 | -12.46 | |||
| Venstre | 7,737 | 18.33 | -7.32 | |||
| Progress Party | 7,643 | 18.11 | New | |||
| Social Liberals | 5,435 | 12.88 | -2.72 | |||
| Christian People's Party | 3,691 | 8.75 | +3.92 | |||
| Conservatives | 3,202 | 7.59 | -5.85 | |||
| Centre Democrats | 2,779 | 6.58 | New | |||
| Green Left | 1,197 | 2.84 | -1.86 | |||
| Justice Party of Denmark | 1,189 | 2.82 | +0.65 | |||
| Communist Party of Denmark | 599 | 1.42 | +0.79 | |||
| Left Socialists | 318 | 0.75 | +0.16 | |||
| Total | 42,203 | |||||
| Source[26] | ||||||
| Parties | Vote | |||||
|---|---|---|---|---|---|---|
| Votes | % | + / - | ||||
| Social Democrats | 12,599 | 32.39 | +1.72 | |||
| Venstre | 9,977 | 25.65 | -10.54 | |||
| Social Liberals | 6,067 | 15.60 | +3.90 | |||
| Conservatives | 5,226 | 13.44 | -1.47 | |||
| Christian People's Party | 1,877 | 4.83 | New | |||
| Green Left | 1,829 | 4.70 | +2.38 | |||
| Justice Party of Denmark | 843 | 2.17 | +0.95 | |||
| Communist Party of Denmark | 244 | 0.63 | +0.44 | |||
| Left Socialists | 230 | 0.59 | -0.07 | |||
| Total | 38,892 | |||||
| Source[27] | ||||||
General elections in the 1960s
| Parties | Vote | |||||
|---|---|---|---|---|---|---|
| Votes | % | + / - | ||||
| Venstre | 8,767 | 36.19 | -0.43 | |||
| Social Democrats | 7,430 | 30.67 | -4.21 | |||
| Conservatives | 3,611 | 14.91 | +1.70 | |||
| Social Liberals | 2,835 | 11.70 | +6.60 | |||
| Green Left | 562 | 2.32 | -1.55 | |||
| Independent Party | 298 | 1.23 | -2.12 | |||
| Justice Party of Denmark | 296 | 1.22 | +0.03 | |||
| Liberal Centre | 217 | 0.90 | -0.67 | |||
| Left Socialists | 160 | 0.66 | New | |||
| Communist Party of Denmark | 46 | 0.19 | -0.02 | |||
| Total | 24,222 | |||||
| Source[28] | ||||||
| Parties | Vote | |||||
|---|---|---|---|---|---|---|
| Votes | % | + / - | ||||
| Venstre | 8,601 | 36.62 | +0.88 | |||
| Social Democrats | 8,193 | 34.88 | -0.69 | |||
| Conservatives | 3,102 | 13.21 | -1.92 | |||
| Social Liberals | 1,198 | 5.10 | +0.94 | |||
| Green Left | 909 | 3.87 | +2.08 | |||
| Independent Party | 786 | 3.35 | -1.23 | |||
| Liberal Centre | 368 | 1.57 | New | |||
| Justice Party of Denmark | 280 | 1.19 | -0.97 | |||
| Communist Party of Denmark | 49 | 0.21 | -0.02 | |||
| Total | 23,486 | |||||
| Source[29] | ||||||
| Parties | Vote | |||||
|---|---|---|---|---|---|---|
| Votes | % | + / - | ||||
| Venstre | 7,765 | 35.74 | +1.21 | |||
| Social Democrats | 7,728 | 35.57 | +1.70 | |||
| Conservatives | 3,288 | 15.13 | +1.79 | |||
| Independent Party | 996 | 4.58 | -3.71 | |||
| Social Liberals | 904 | 4.16 | -0.39 | |||
| Justice Party of Denmark | 469 | 2.16 | -1.07 | |||
| Green Left | 388 | 1.79 | -0.04 | |||
| Danish Unity | 83 | 0.38 | New | |||
| Peace Politics People's Party | 58 | 0.27 | New | |||
| Communist Party of Denmark | 50 | 0.23 | -0.03 | |||
| Total | 21,729 | |||||
| Source[30] | ||||||
| Parties | Vote | |||||
|---|---|---|---|---|---|---|
| Votes | % | + / - | ||||
| Venstre | 6,686 | 34.53 | -7.08 | |||
| Social Democrats | 6,558 | 33.87 | +4.96 | |||
| Conservatives | 2,583 | 13.34 | +2.68 | |||
| Independent Party | 1,606 | 8.29 | +2.83 | |||
| Social Liberals | 882 | 4.55 | -0.40 | |||
| Justice Party of Denmark | 625 | 3.23 | -4.50 | |||
| Green Left | 355 | 1.83 | New | |||
| Communist Party of Denmark | 51 | 0.26 | -0.42 | |||
| Jon Galster | 18 | 0.09 | New | |||
| Total | 19,364 | |||||
| Source[31] | ||||||
General elections in the 1950s
| Parties | Vote | |||||
|---|---|---|---|---|---|---|
| Votes | % | + / - | ||||
| Venstre | 7,478 | 41.61 | +2.00 | |||
| Social Democrats | 5,196 | 28.91 | -3.01 | |||
| Conservatives | 1,916 | 10.66 | +0.11 | |||
| Justice Party of Denmark | 1,389 | 7.73 | +3.03 | |||
| Independent Party | 981 | 5.46 | -1.35 | |||
| Social Liberals | 889 | 4.95 | -0.50 | |||
| Communist Party of Denmark | 123 | 0.68 | -0.28 | |||
| Total | 17,972 | |||||
| Source[32] | ||||||
September 1953 Danish Folketing election
| Parties | Vote | |||||
|---|---|---|---|---|---|---|
| Votes | % | + / - | ||||
| Venstre | 6,291 | 39.61 | -0.82 | |||
| Social Democrats | 5,069 | 31.92 | +0.48 | |||
| Conservatives | 1,675 | 10.55 | -1.33 | |||
| Independent Party | 1,082 | 6.81 | New | |||
| Social Liberals | 866 | 5.45 | -0.54 | |||
| Justice Party of Denmark | 747 | 4.70 | -3.59 | |||
| Communist Party of Denmark | 152 | 0.96 | -0.24 | |||
| Total | 15,882 | |||||
| Source[33] | ||||||
April 1953 Danish Folketing election
| Parties | Vote | |||||
|---|---|---|---|---|---|---|
| Votes | % | + / - | ||||
| Venstre | 5,879 | 40.43 | -0.56 | |||
| Social Democrats | 4,571 | 31.44 | -0.07 | |||
| Conservatives | 1,727 | 11.88 | -0.15 | |||
| Justice Party of Denmark | 1,205 | 8.29 | -1.56 | |||
| Social Liberals | 871 | 5.99 | +1.32 | |||
| Communist Party of Denmark | 174 | 1.20 | +0.26 | |||
| Danish Unity | 114 | 0.78 | New | |||
| Total | 14,541 | |||||
| Source[34] | ||||||
1950 Danish Folketing election
| Parties | Vote | |||||
|---|---|---|---|---|---|---|
| Votes | % | + / - | ||||
| Venstre | 6,061 | 40.99 | -10.19 | |||
| Social Democrats | 4,659 | 31.51 | +1.50 | |||
| Conservatives | 1,779 | 12.03 | +5.04 | |||
| Justice Party of Denmark | 1,457 | 9.85 | +4.76 | |||
| Social Liberals | 690 | 4.67 | +0.55 | |||
| Communist Party of Denmark | 139 | 0.94 | -0.58 | |||
| Total | 14,785 | |||||
| Source[35] | ||||||
General elections in the 1940s
1947 Danish Folketing election
| Parties | Vote | |||||
|---|---|---|---|---|---|---|
| Votes | % | + / - | ||||
| Venstre | 7,544 | 51.18 | +3.37 | |||
| Social Democrats | 4,424 | 30.01 | +1.24 | |||
| Conservatives | 1,031 | 6.99 | -2.09 | |||
| Justice Party of Denmark | 750 | 5.09 | +2.38 | |||
| Social Liberals | 607 | 4.12 | -2.00 | |||
| Communist Party of Denmark | 224 | 1.52 | -1.50 | |||
| Danish Unity | 160 | 1.09 | -1.40 | |||
| Total | 14,740 | |||||
| Source[36] | ||||||
1945 Danish Folketing election
| Parties | Vote | |||||
|---|---|---|---|---|---|---|
| Votes | % | + / - | ||||
| Venstre | 6,870 | 47.81 | +6.39 | |||
| Social Democrats | 4,134 | 28.77 | -3.69 | |||
| Conservatives | 1,304 | 9.08 | -3.76 | |||
| Social Liberals | 880 | 6.12 | +1.68 | |||
| Communist Party of Denmark | 434 | 3.02 | New | |||
| Justice Party of Denmark | 389 | 2.71 | +0.85 | |||
| Danish Unity | 358 | 2.49 | +1.36 | |||
| Total | 14,369 | |||||
| Source[37] | ||||||
1943 Danish Folketing election
| Parties | Vote | |||||
|---|---|---|---|---|---|---|
| Votes | % | + / - | ||||
| Venstre | 5,731 | 41.42 | +6.19 | |||
| Social Democrats | 4,491 | 32.46 | +2.30 | |||
| Conservatives | 1,776 | 12.84 | +2.19 | |||
| Farmers' Party | 671 | 4.85 | -9.29 | |||
| Social Liberals | 614 | 4.44 | -1.06 | |||
| Justice Party of Denmark | 258 | 1.86 | -0.74 | |||
| Danish Unity | 156 | 1.13 | +0.89 | |||
| National Socialist Workers' Party of Denmark | 138 | 1.00 | +0.46 | |||
| Total | 13,835 | |||||
| Source[38] | ||||||
General elections in the 1930s
1939 Danish Folketing election
| Parties | Vote | |||||
|---|---|---|---|---|---|---|
| Votes | % | + / - | ||||
| Venstre | 4,160 | 35.23 | +2.87 | |||
| Social Democrats | 3,561 | 30.16 | -0.21 | |||
| Farmers' Party | 1,669 | 14.14 | -4.11 | |||
| Conservatives | 1,257 | 10.65 | -1.16 | |||
| Social Liberals | 649 | 5.50 | +1.10 | |||
| Justice Party of Denmark | 307 | 2.60 | +0.54 | |||
| Communist Party of Denmark | 65 | 0.55 | +0.14 | |||
| National Socialist Workers' Party of Denmark | 64 | 0.54 | +0.21 | |||
| National Cooperation | 47 | 0.40 | New | |||
| Danish Unity | 28 | 0.24 | New | |||
| Total | 11,807 | |||||
| Source[39] | ||||||
1935 Danish Folketing election
| Parties | Vote | |||||
|---|---|---|---|---|---|---|
| Votes | % | + / - | ||||
| Venstre | 3,575 | 32.36 | -19.61 | |||
| Social Democrats | 3,355 | 30.37 | +3.66 | |||
| Independent People's Party | 2,016 | 18.25 | New | |||
| Conservatives | 1,304 | 11.81 | -1.50 | |||
| Social Liberals | 486 | 4.40 | -1.20 | |||
| Justice Party of Denmark | 228 | 2.06 | -0.36 | |||
| Communist Party of Denmark | 45 | 0.41 | New | |||
| National Socialist Workers' Party of Denmark | 37 | 0.33 | New | |||
| Total | 11,046 | |||||
| Source[40] | ||||||
1932 Danish Folketing election
| Parties | Vote | |||||
|---|---|---|---|---|---|---|
| Votes | % | + / - | ||||
| Venstre | 5,572 | 51.97 | -6.83 | |||
| Social Democrats | 2,864 | 26.71 | +0.67 | |||
| Conservatives | 1,427 | 13.31 | +4.87 | |||
| Social Liberals | 600 | 5.60 | 0.00 | |||
| Justice Party of Denmark | 259 | 2.42 | +1.30 | |||
| Total | 10,722 | |||||
| Source[41] | ||||||
General elections in the 1920s
1929 Danish Folketing election
| Parties | Vote | |||||
|---|---|---|---|---|---|---|
| Votes | % | + / - | ||||
| Venstre | 6,016 | 58.80 | -1.29 | |||
| Social Democrats | 2,664 | 26.04 | +1.67 | |||
| Conservatives | 864 | 8.44 | -2.31 | |||
| Social Liberals | 573 | 5.60 | +1.26 | |||
| Justice Party of Denmark | 115 | 1.12 | +0.66 | |||
| Total | 10,232 | |||||
| Source[42] | ||||||
1926 Danish Folketing election
| Parties | Vote | |||||
|---|---|---|---|---|---|---|
| Votes | % | + / - | ||||
| Venstre | 5,647 | 60.09 | -2.32 | |||
| Social Democrats | 2,290 | 24.37 | +1.07 | |||
| Conservatives | 1,010 | 10.75 | +1.57 | |||
| Social Liberals | 408 | 4.34 | +0.03 | |||
| Justice Party of Denmark | 43 | 0.46 | -0.19 | |||
| Total | 9,398 | |||||
| Source[43] | ||||||
1924 Danish Folketing election
| Parties | Vote | |||||
|---|---|---|---|---|---|---|
| Votes | % | + / - | ||||
| Venstre | 5,624 | 62.41 | -11.66 | |||
| Social Democrats | 2,100 | 23.30 | +7.46 | |||
| Conservatives | 827 | 9.18 | +3.56 | |||
| Social Liberals | 388 | 4.31 | +0.84 | |||
| Justice Party of Denmark | 59 | 0.65 | New | |||
| Farmer Party | 13 | 0.14 | New | |||
| Total | 9,011 | |||||
| Source[44] | ||||||
September 1920 Danish Folketing election
| Parties | Vote | |||||
|---|---|---|---|---|---|---|
| Votes | % | + / - | ||||
| Venstre | 6,561 | 74.07 | -2.83 | |||
| Social Democrats | 1,403 | 15.84 | +2.32 | |||
| Conservatives | 498 | 5.62 | +0.16 | |||
| Social Liberals | 307 | 3.47 | +0.09 | |||
| Industry Party | 89 | 1.00 | +0.26 | |||
| Total | 8,858 | |||||
| Source[45] | ||||||
July 1920 Danish Folketing election
| Parties | Vote | |||||
|---|---|---|---|---|---|---|
| Votes | % | + / - | ||||
| Venstre | 5,749 | 76.90 | +0.92 | |||
| Social Democrats | 1,011 | 13.52 | -0.87 | |||
| Conservatives | 408 | 5.46 | -0.27 | |||
| Social Liberals | 253 | 3.38 | -0.52 | |||
| Industry Party | 55 | 0.74 | New | |||
| Total | 7,476 | |||||
| Source[46] | ||||||
April 1920 Danish Folketing election
| Parties | Vote | |||||
|---|---|---|---|---|---|---|
| Votes | % | |||||
| Venstre | 5,979 | 75.98 | ||||
| Social Democrats | 1,132 | 14.39 | ||||
| Conservatives | 451 | 5.73 | ||||
| Social Liberals | 307 | 3.90 | ||||
| Total | 7,869 | |||||
| Source[47] | ||||||
European Parliament elections results
2019 European Parliament election in Denmark
| Parties | Vote | |||||
|---|---|---|---|---|---|---|
| Votes | % | + / - | ||||
| Venstre | 13,614 | 47.10 | +25.41 | |||
| Social Democrats | 5,388 | 18.64 | -0.70 | |||
| Green Left | 2,458 | 8.50 | +0.36 | |||
| Danish People's Party | 2,421 | 8.38 | -20.94 | |||
| Social Liberals | 1,698 | 5.87 | +0.96 | |||
| Conservatives | 858 | 2.97 | -6.13 | |||
| Red–Green Alliance | 850 | 2.94 | New | |||
| People's Movement against the EU | 754 | 2.61 | -2.71 | |||
| The Alternative | 438 | 1.52 | New | |||
| Liberal Alliance | 427 | 1.48 | -0.70 | |||
| Total | 28,906 | |||||
| Source[48] | ||||||
2014 European Parliament election in Denmark
| Parties | Vote | |||||
|---|---|---|---|---|---|---|
| Votes | % | + / - | ||||
| Danish People's Party | 6,788 | 29.32 | +15.03 | |||
| Venstre | 5,021 | 21.69 | -5.04 | |||
| Social Democrats | 4,478 | 19.34 | +0.20 | |||
| Conservatives | 2,106 | 9.10 | -5.62 | |||
| Green Left | 1,884 | 8.14 | -5.13 | |||
| People's Movement against the EU | 1,231 | 5.32 | -0.11 | |||
| Social Liberals | 1,137 | 4.91 | +0.69 | |||
| Liberal Alliance | 504 | 2.18 | +1.68 | |||
| Total | 23,149 | |||||
| Source[49] | ||||||
2009 European Parliament election in Denmark
| Parties | Vote | |||||
|---|---|---|---|---|---|---|
| Votes | % | + / - | ||||
| Venstre | 6,469 | 26.73 | -1.65 | |||
| Social Democrats | 4,633 | 19.14 | -13.81 | |||
| Conservatives | 3,563 | 14.72 | +5.63 | |||
| Danish People's Party | 3,457 | 14.29 | +8.49 | |||
| Green Left | 3,211 | 13.27 | +8.20 | |||
| People's Movement against the EU | 1,313 | 5.43 | +2.13 | |||
| Social Liberals | 1,022 | 4.22 | -0.78 | |||
| June Movement | 411 | 1.70 | -4.81 | |||
| Liberal Alliance | 121 | 0.50 | New | |||
| Total | 24,200 | |||||
| Source[50] | ||||||
2004 European Parliament election in Denmark
| Parties | Vote | |||||
|---|---|---|---|---|---|---|
| Votes | % | + / - | ||||
| Social Democrats | 9,228 | 32.95 | +18.45 | |||
| Venstre | 7,947 | 28.38 | -2.58 | |||
| Conservatives | 2,545 | 9.09 | +0.63 | |||
| June Movement | 1,823 | 6.51 | -7.69 | |||
| Danish People's Party | 1,624 | 5.80 | +0.63 | |||
| Green Left | 1,420 | 5.07 | -1.34 | |||
| Social Liberals | 1,401 | 5.00 | -2.60 | |||
| Christian Democrats | 1,090 | 3.89 | -0.81 | |||
| People's Movement against the EU | 925 | 3.30 | -1.79 | |||
| Total | 28,003 | |||||
| Source[51] | ||||||
1999 European Parliament election in Denmark
| Parties | Vote | |||||
|---|---|---|---|---|---|---|
| Votes | % | + / - | ||||
| Venstre | 8,436 | 30.96 | +6.43 | |||
| Social Democrats | 3,952 | 14.50 | -0.71 | |||
| June Movement | 3,870 | 14.20 | -1.25 | |||
| Conservatives | 2,305 | 8.46 | -10.91 | |||
| Social Liberals | 2,071 | 7.60 | +0.85 | |||
| Green Left | 1,748 | 6.41 | +1.43 | |||
| Danish People's Party | 1,410 | 5.17 | New | |||
| People's Movement against the EU | 1,387 | 5.09 | -1.59 | |||
| Christian Democrats | 1,282 | 4.70 | +1.89 | |||
| Centre Democrats | 790 | 2.90 | +2.02 | |||
| Progress Party | 248 | 0.91 | -2.43 | |||
| Total | 27,251 | |||||
| Source[52] | ||||||
1994 European Parliament election in Denmark
| Parties | Vote | |||||
|---|---|---|---|---|---|---|
| Votes | % | + / - | ||||
| Venstre | 7,383 | 24.53 | -4.33 | |||
| Conservatives | 5,830 | 19.37 | +9.75 | |||
| June Movement | 4,652 | 15.45 | New | |||
| Social Democrats | 4,580 | 15.21 | -4.32 | |||
| Social Liberals | 2,032 | 6.75 | +4.12 | |||
| People's Movement against the EU | 2,010 | 6.68 | -4.56 | |||
| Green Left | 1,499 | 4.98 | -0.73 | |||
| Progress Party | 1,006 | 3.34 | -2.98 | |||
| Christian Democrats | 847 | 2.81 | -3.29 | |||
| Centre Democrats | 264 | 0.88 | -9.12 | |||
| Total | 30,103 | |||||
| Source[53] | ||||||
1989 European Parliament election in Denmark
| Parties | Vote | |||||
|---|---|---|---|---|---|---|
| Votes | % | + / - | ||||
| Venstre | 7,095 | 28.86 | +2.01 | |||
| Social Democrats | 4,801 | 19.53 | +3.36 | |||
| People's Movement against the EU | 2,763 | 11.24 | -2.90 | |||
| Centre Democrats | 2,458 | 10.00 | +1.48 | |||
| Conservatives | 2,366 | 9.62 | -6.15 | |||
| Progress Party | 1,553 | 6.32 | +2.56 | |||
| Christian Democrats | 1,499 | 6.10 | -0.43 | |||
| Green Left | 1,404 | 5.71 | +0.24 | |||
| Social Liberals | 646 | 2.63 | +0.23 | |||
| Total | 24,585 | |||||
| Source[54] | ||||||
1984 European Parliament election in Denmark
| Parties | Vote | |||||
|---|---|---|---|---|---|---|
| Votes | % | |||||
| Venstre | 7,718 | 26.85 | ||||
| Social Democrats | 4,649 | 16.17 | ||||
| Conservatives | 4,534 | 15.77 | ||||
| People's Movement against the EU | 4,066 | 14.14 | ||||
| Centre Democrats | 2,448 | 8.52 | ||||
| Christian Democrats | 1,877 | 6.53 | ||||
| Green Left | 1,573 | 5.47 | ||||
| Progress Party | 1,081 | 3.76 | ||||
| Social Liberals | 690 | 2.40 | ||||
| Left Socialists | 112 | 0.39 | ||||
| Total | 28,748 | |||||
| Source[55] | ||||||
Referendums
2022 Danish European Union opt-out referendum[56]
| Option | Votes | % |
|---|---|---|
| ✓ YES | 18,529 | 66.15 |
| X NO | 9,482 | 33.85 |
2015 Danish European Union opt-out referendum[57]
| Option | Votes | % |
|---|---|---|
| X NO | 15,826 | 50.71 |
| ✓ YES | 15,383 | 49.29 |
2014 Danish Unified Patent Court membership referendum[58]
| Option | Votes | % |
|---|---|---|
| ✓ YES | 14,711 | 65.03 |
| X NO | 7,910 | 34.97 |
2009 Danish Act of Succession referendum[59]
| Option | Votes | % |
|---|---|---|
| ✓ YES | 20,000 | 85.76 |
| X NO | 3,320 | 14.24 |
2000 Danish euro referendum[60]
| Option | Votes | % |
|---|---|---|
| X NO | 26,062 | 51.34 |
| ✓ YES | 24,697 | 48.66 |
1998 Danish Amsterdam Treaty referendum[61]
| Option | Votes | % |
|---|---|---|
| ✓ YES | 25,789 | 59.28 |
| X NO | 17,718 | 40.72 |
1993 Danish Maastricht Treaty referendum[62]
| Option | Votes | % |
|---|---|---|
| ✓ YES | 31,422 | 63.68 |
| X NO | 17,918 | 36.32 |
1992 Danish Maastricht Treaty referendum[63]
| Option | Votes | % |
|---|---|---|
| ✓ YES | 25,454 | 53.84 |
| X NO | 21,823 | 46.16 |
1986 Danish Single European Act referendum[64]
| Option | Votes | % |
|---|---|---|
| ✓ YES | 29,100 | 68.48 |
| X NO | 13,397 | 31.52 |
1972 Danish European Communities membership referendum[65]
| Option | Votes | % |
|---|---|---|
| ✓ YES | 30,348 | 73.34 |
| X NO | 11,034 | 26.66 |
1953 Danish constitutional and electoral age referendum[66]
| Option | Votes | % |
|---|---|---|
| ✓ YES | 7,220 | 75.08 |
| X NO | 2,397 | 24.92 |
| 23 years | 6,450 | 64.92 |
| 21 years | 3,485 | 35.08 |
1939 Danish constitutional referendum[67]
| Option | Votes | % |
|---|---|---|
| ✓ YES | 3,581 | 85.32 |
| X NO | 616 | 14.68 |
References
- ↑ "Holstebrokredsen". kmdvalg.dk (in Danish). Retrieved 2023-06-04.
- ↑ "Beretning om Forhandlingerne paa Rigsdagen". Rigsdagstidende. II: Spalte 3892 ff.
- ↑ "Nye valgkredse fordeler stemmerne anderledes". dr.dk (in Danish). Retrieved 2023-06-04.
- ↑ "Beretning om nye valgkredse som følge af kommunalreformen" (in Danish). Retrieved 2023-06-04.
- ↑ "Det danske valgsystem: Valg til Folketinget". valg.im (in Danish). Retrieved 2023-06-04.
- ↑ "82 Holstebro". dataforsyningen.dk (in Danish). Retrieved 2023-06-04.
- ↑ "Beretning om Forhandlingerne paa Rigsdagen". Rigsdagstidende. II: Spalte 3892 ff.
- ↑ "Valgresultater fra tidligere valg:". kmdvalg (in Danish). Retrieved 2023-06-04.
- ↑ "FOLKETINGSVALG TIRSDAG 1. NOVEMBER 2022". valg.im (in Danish). Retrieved 2023-06-27.
- ↑ "FOLKETINGSVALG ONSDAG 5. JUNI 2019". valg.im (in Danish). Retrieved 2023-06-27.
- ↑ "FOLKETINGSVALG TORSDAG 18. JUNI 2015". valg.im (in Danish). Retrieved 2023-06-27.
- ↑ "FOLKETINGSVALG TORSDAG 15. SEPTEMBER 2011". valg.im (in Danish). Retrieved 2023-06-27.
- ↑ "Folketingsvalget den 13. november 2007". valg.im (in Danish). Retrieved 2023-06-27.
- ↑ "valg2005.book" (PDF). valg.im (in Danish). Retrieved 2023-06-27.
- ↑ "BMTABEL" (PDF). valg.im (in Danish). Retrieved 2023-06-27.
- ↑ "VALG98" (PDF). valg.im (in Danish). Retrieved 2023-06-27.
- ↑ "VALG94" (PDF). valg.im (in Danish). Retrieved 2023-06-27.
- ↑ "VALG90" (PDF). valg.im (in Danish). Retrieved 2023-06-27.
- ↑ "Folketingsvalget den 10. maj 1988". valg.im (in Danish). Retrieved 2023-06-27.
- ↑ "Folketingsvalget den 8.september 1987". dst.dk (in Danish). Retrieved 2023-06-27.
- ↑ "Folketingsvalget den 10. januar 1984". dst.dk (in Danish). Retrieved 2023-06-27.
- ↑ "Folketingsvalget den 8. december 1981". dst.dk (in Danish). Retrieved 2023-06-27.
- ↑ "Folketingsvalget den 23. oktober 1979". dst.dk (in Danish). Retrieved 2023-06-27.
- ↑ "Folketingsvalget den 15. februar 1977". dst.dk (in Danish). Retrieved 2023-06-27.
- ↑ "Folketingsvalget den 9. januar 1975". dst.dk (in Danish). Retrieved 2023-06-27.
- ↑ "Folketingsvalget den 4. december 1973". dst.dk (in Danish). Retrieved 2023-06-27.
- ↑ "Folketingsvalget den 21. september 1971 samt folkeafstemningen". dst.dk (in Danish). Retrieved 2023-06-27.
- ↑ "Folketingsvalget den 23. januar 1968". dst.dk (in Danish). Retrieved 2023-06-27.
- ↑ "Folketingsvalget den 22. november 1966". dst.dk (in Danish). Retrieved 2023-06-27.
- ↑ "Folketingsvalget den 22. september 1964". dst.dk (in Danish). Retrieved 2023-06-27.
- ↑ "Folketingsvalget den 15. november 1960". dst.dk (in Danish). Retrieved 2023-06-27.
- ↑ "Folketingsvalget den 14. maj 1957". dst.dk (in Danish). Retrieved 2023-06-27.
- ↑ "Folketingsvalget den 22. september 1953". dst.dk (in Danish). Retrieved 2023-06-27.
- ↑ "Rigsdagsvalgene og folkeafstemningerne i april og maj 1953". dst.dk (in Danish). Retrieved 2023-06-27.
- ↑ "Folketingsvalget den 5. september 1950". dst.dk (in Danish). Retrieved 2023-06-27.
- ↑ "Folketingsvalget den 28. oktober 1947". dst.dk (in Danish). Retrieved 2023-06-27.
- ↑ "Rigsdagsvalgene i oktober og november 1945". dst.dk (in Danish). Retrieved 2023-06-27.
- ↑ "Rigsdagsvalgene i marts og april 1943". dst.dk (in Danish). Retrieved 2023-06-27.
- ↑ "Rigsdagsvalgene og Folkeafstemningen i april og maj 1939". dst.dk (in Danish). Retrieved 2023-06-27.
- ↑ "Folketingsvalget den 22. oktober 1935". dst.dk (in Danish). Retrieved 2023-06-27.
- ↑ "Folketingsvalget den 16. november 1932". dst.dk (in Danish). Retrieved 2023-06-27.
- ↑ "Folketingsvalget den 24. april 1929". dst.dk (in Danish). Retrieved 2023-06-27.
- ↑ "Folketingsvalget den 2. december 1926". dst.dk (in Danish). Retrieved 2023-06-27.
- ↑ "Folketingsvalget den 11. april 1924". dst.dk (in Danish). Retrieved 2023-06-27.
- ↑ "Rigsdagsvalgene september-oktober 1920". dst.dk (in Danish). Retrieved 2023-06-27.
- ↑ "Rigsdagsvalgene juli-august 1920". dst.dk (in Danish). Retrieved 2023-06-27.
- ↑ "Folketingsvalget den 26. april 1920". dst.dk (in Danish). Retrieved 2023-06-27.
- ↑ "EUROPA-PARLAMENTSVALG SØNDAG 26. MAJ 2019". dst.dk (in Danish). Retrieved 2023-07-01.
- ↑ "EUROPA-PARLAMENTSVALG SØNDAG 25. MAJ 2014". dst.dk (in Danish). Retrieved 2023-07-01.
- ↑ "EUROPA-PARLAMENTSVALG SØNDAG 7. JUNI 2009". dst.dk (in Danish). Retrieved 2023-07-01.
- ↑ "EUROPA-PARLAMENTSVALGET DEN 13. JUNI 2004" (PDF). im.dk (in Danish). Retrieved 2023-07-01.
- ↑ "VALGET TIL EUROPA-PARLAMENTET DEN 10. JUNI 1999" (PDF). im.dk (in Danish). Retrieved 2023-07-01.
- ↑ "VALGET TIL EUROPA-PARLAMENTET DEN 9. JUNI 1994" (PDF). im.dk (in Danish). Retrieved 2023-07-01.
- ↑ "Valget til Europa-parlamentet den 15. juni 1989". dst.dk (in Danish). Retrieved 2023-07-01.
- ↑ "Valget til Europa-Parlamentet den 14. juni 1984". dst.dk (in Danish). Retrieved 2023-07-01.
- ↑ "FOLKEAFSTEMNING ONSDAG 1. JUNI 2022". dst.dk (in Danish). Retrieved 2023-07-05.
- ↑ "FOLKEAFSTEMNING TORSDAG 3. DECEMBER 2015". dst.dk (in Danish). Retrieved 2023-07-05.
- ↑ "FOLKEAFSTEMNING SØNDAG 25. MAJ 2014". dst.dk (in Danish). Retrieved 2023-07-05.
- ↑ "FOLKEAFSTEMNING SØNDAG 7. JUNI 2009". dst.dk (in Danish). Retrieved 2023-07-05.
- ↑ "FOLKEAFSTEMNINGEN DEN 28. SEPTEMBER 2000 OM DANMARKS DELTAGELSE I DEN FÆLLES VALUTA" (PDF). valg.im (in Danish). Retrieved 2023-07-05.
- ↑ "FOLKEAFSTEMNINGEN DEN 28. MAJ 1998OM DANMARKS TILTRÆDELSE AF AMSTERDAMTRAKTATEN" (PDF). valg.im (in Danish). Retrieved 2023-07-05.
- ↑ "FOLKEAFSTEMNINGEN DEN 18. MAJ 1993 OM DANMARKS TILTRÆDELSE AF EDINBURGH-AFGØRELSEN OG MAASTRICHT-TRAKTATEN". dst.dk (in Danish). Retrieved 2023-07-05.
- ↑ "Folkeafstemningen den 1. juni 1992 om Danmarks tiltrædelse af traktaten om Den Europæiske Union". dst.dk (in Danish). Retrieved 2023-07-05.
- ↑ "Vejledende folkeafstemning torsdag den 27. februar 1986 om Danmarks tiltrædelse af EF- pakken". dst.dk (in Danish). Retrieved 2023-07-05.
- ↑ "Folkeafstemningen om Danmarks tiltrædelse af De europæiske Fælleskaber 2. oktober 1972". dst.dk (in Danish). Retrieved 2023-07-05.
- ↑ "Publikationsfortegnelse vedrørende Folkeafstemninger". dst.dk (in Danish). Retrieved 2023-07-05.
- ↑ "Publikationsfortegnelse vedrørende Folkeafstemninger". dst.dk (in Danish). Retrieved 2023-07-05.