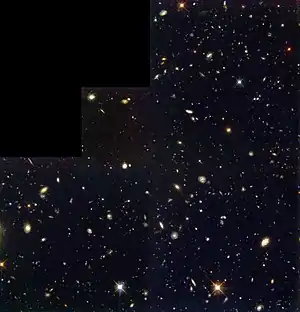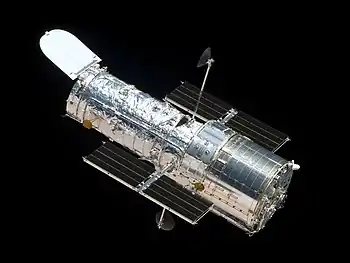
The Hubble Deep Field South is a composite of several hundred individual images taken using the Hubble Space Telescope's Wide Field and Planetary Camera 2 over 10 days in September and October 1998. It followed the great success of the original Hubble Deep Field in facilitating the study of extremely distant galaxies in early stages of their evolution. While the WFPC2 took very deep optical images, nearby fields were simultaneously imaged by the Space Telescope Imaging Spectrograph (STIS) and the Near Infrared Camera and Multi-Object Spectrometer (NICMOS).
Planning
The rationale behind making another Deep Field image was to provide observatories in the southern hemisphere with a similarly deep optical image of the distant universe as had been provided to those in the northern hemisphere.[1]
The field chosen was in the constellation of Tucana at a right ascension of 22h 32m 56.22s and declination of −60° 33′ 02.69″.[2] As with the original Hubble Deep Field (referred to hereafter as the 'HDF-N'), the target area was selected to be far from the plane of the Milky Way's galactic disk, which contains a large amount of obscuring matter, and to contain as few galactic stars as possible. However the field is closer to the galactic plane than the HDF-N, meaning that it contains more galactic stars. It also has a nearby bright star, as well as a moderately strong radio source close by, but in both cases it was decided that these wouldn't compromise follow-up observations.[3]
As with the HDF-N, the field lies in Hubble's Continuous Viewing Zone (CVZ), this time in the south, allowing twice the normal observing time per orbit. At specific times of year, the HST can observe this zone continuously, without it being eclipsed by the Earth.[4] Viewing this field, however, has some issues due to passages through the South Atlantic Anomaly and also with scattered earthshine during daylight hours; the latter can be avoided by using instruments with larger sources of noise, for example from the CCD reading process, at those times. The survey again used Director's Discretionary Time.[3]
The field was imaged briefly on October 30–31, 1997[5] to make sure that the guide stars in the field were acceptable; these guide stars would be required to keep the HST accurately pointing on the region during the observations proper.[1]
Observations
The observing strategy for the HDF-S was similar to that of the HDF-N, with the same optical filters used for the WFPC2 images (isolating wavelengths at 300, 450, 606 and 814 nanometres), and similar total exposure times. The observations were made over 10 days in September and October 1998,[6] a total of 150 orbits, and had a total exposure time of over 1.3 million seconds. While the WFPC2 took very deep optical images, the fields were simultaneously imaged by the Space Telescope Imaging Spectrograph (STIS) and the Near Infrared Camera and Multi-Object Spectrometer (NICMOS). A number of flanking fields were also observed for shorter periods of time.[3]
The WFPC2 image is 5.3 square arcminutes, whilst the NICMOS and STIS images are only 0.7 square arcminutes.[7]
| Camera | Filter | Wavelength | Total exposure time | Exposures |
|---|---|---|---|---|
| WFPC2 | F300W | 300 nm (U-band) | 140,400 s | 106 |
| WFPC2 | F450W | 450 nm (B-band) | 103,500 s | 67 |
| WFPC2 | F606W | 606 nm (V-band) | 99,300 s | 53 |
| WFPC2 | F814W | 814 nm (I-band) | 113,900 s | 57 |
| NICMOS NIC3 | F110W | 1,100 nm (J-band) | 162,600 s | 142 |
| NICMOS NIC3 | F160W | 1,600 nm (H-band) | 171,200 s | 150 |
| NICMOS NIC3 | F222M | 2,220 mm (K-band) | 105,000 s | 102 |
| STIS | 50CCD | 350–950 nm | 155,600 s | 67 |
| STIS | F28X50LP | 550–960 nm | 49,800 s | 64 |
| STIS | MIRFUV | 150–170 nm | 52,100 s | 25 |
| STIS | MIRNUV | 160–320 nm | 22,600 s | 12 |
| Spectroscopy | G430M | 302.2–356.6 nm | 57,100 s | 61 |
| Spectroscopy | G140L | 115–173 nm | 18,500 s | 8 |
| Spectroscopy | E230M | 227.8–312 nm | 151,100 s | 69 |
| Spectroscopy | G230L | 157–318 nm | 18,400 s | 12 |
As with the HDF-N, the images were processed using a technique known as 'drizzling', in which the direction the telescope was aimed was changed by a very small amount between exposures, and the resulting images combined using sophisticated techniques to achieve a higher angular resolution than would otherwise be possible. Translational changes were fine during the imaging parts of the observation; however, the telescope had to be rotated by small amounts instead of repointed during the spectroscopic work, such that the centre of the STIS instrument was kept on the central quasar.[3] The HDF-S final image had a pixel scale of 0.0398 arcseconds.[8]
Contents
The cosmological principle states that at the largest scales, the universe is homogeneous and isotropic, meaning that it should look the same in any direction. The HDF-S would thus be expected to strongly resemble the HDF-N, and this was indeed the case, with large numbers of galaxies visible displaying a similar range of colours and morphologies to those seen in the HDF-N, and very similar numbers of galaxies in each of the fields.[4]
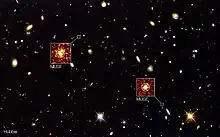
One difference with the HDF-N was that the HDF-S included a known quasar with a redshift value of 2.24, J2233-606, discovered during the search for the target field. The quasar provides a probe of the gas along the line of sight where the foreground objects are also observed, allowing an investigation into the association of galaxies with absorption features. Including a quasar in the field of view was originally considered for the HDF-N, but was decided against due to concerns about increased numbers of galaxies associated with the quasar might skew the galaxy number counts, and because there was not a favourably located quasar. For the Southern field, however, such a skewed count wasn't a concern due to the known counts from the HDF-N.[3]
Scientific results
As with the HDF-N, the HDF-S provided rich pickings for cosmologists. Many studies of the HDF-S confirmed results found from the HDF-N, such as star formation rates over the lifetime of the universe. The HDF-S was also extensively used in studies of how galaxies evolve over time, both due to internal processes and encounters with other galaxies.[9][10]
Follow-up observations
Following Hubble's observations of the HDF-S field, the field was also surveyed in the UV/optical/infrared frequency range by the Anglo-Australian Observatory, the Cerro Tololo Interamerican Observatory and the European Southern Observatory. At mid-infrared it was observed by the Infrared Space Observatory, and radio observations were made by the Australia Telescope National Facility.[12]
See also
References
- 1 2 "HDF-S Project Description". STScI. Retrieved December 28, 2008.
- ↑ "HDF-S Coordinates". STScI. Retrieved December 26, 2008.
- 1 2 3 4 5 6 Williams et al. (2000)
- 1 2 Casertano et al. (2000)
- ↑ "HDF-S 1997 TEST Observations". STScI. Retrieved December 28, 2008.
- ↑ "The Universe "Down Under" is the Latest Target for Hubble's Latest Deep-View". NASA. November 23, 1998. Retrieved December 11, 2022.
- ↑ Ferguson (2000)
- ↑ Volonteri, M.; Saracco1, P.; Chincarini, G. (May 2, 2000). "A catalogue of galaxies in the HDF-South: Photometry and structural parameters". Astron. Astrophys. Suppl. Ser. 145: 111–120. arXiv:astro-ph/0005204. Bibcode:2000A&AS..145..111V. doi:10.1051/aas:2000233. S2CID 15922789. Retrieved December 11, 2022.
{{cite journal}}: CS1 maint: numeric names: authors list (link) - ↑ Ferguson, Henry C.; Dickinson, Mark; Williams, Robert. "Galaxies". The Hubble Deep Fields (Report). Cal Tech. Retrieved December 11, 2022.
- ↑ "The Hubble Ultra Deep Field" (PDF). NASA. Retrieved December 11, 2022.
- ↑ "Looking Deeply into the Universe in 3D". ESO Press Release. European Southern Observatory. Retrieved February 27, 2015.
- ↑ "HDF-S Clearinghouse". STScI. Retrieved December 28, 2008.
Bibliography
- Casertano, S.; et al. (2000). "WFPC2 Observations of the Hubble Deep Field South". The Astronomical Journal. 120 (6): 2747–2824. arXiv:astro-ph/0010245. Bibcode:2000AJ....120.2747C. doi:10.1086/316851. S2CID 119058107.
- Ferguson, H.C. (2000a). "The Hubble Deep Fields". In N Manset; C Veillet; D Crabtree (eds.). ASP Conference Proceedings. Astronomical Data Analysis Software and Systems IX. Vol. 216. Astronomical Society of the Pacific. pp. 395. ISBN 1-58381-047-1.
- Williams, R.E.; et al. (2000). "The Hubble Deep Field South: Formulation of the Observing Campaign". The Astronomical Journal. 120 (6): 2735–2746. Bibcode:2000AJ....120.2735W. doi:10.1086/316854.
External links
- "HDF-S". STScI. Main Hubble Deep Field South website.


