| Hvidovre | |
|---|---|
| Hvidovre | |
| Nomination district constituency for the Folketing | |
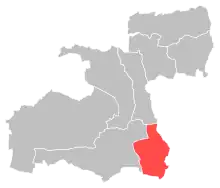 Location of Hvidovre within Greater Copenhagen | |
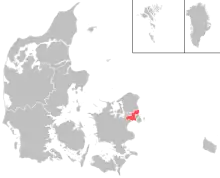 Location of Greater Copenhagen within Denmark | |
| Municipalities | Hvidovre |
| Constituency | Greater Copenhagen |
| Electorate | 36,088 (2022)[1] |
| Current constituency | |
| Created | 1953[2] |
Hvidovre nominating district is one of the 92 nominating districts that exists for Danish elections following the 2007 municipal reform.[3][4][5] It consists of Hvidovre Municipality.[6] It was created in 1953,[7] though its boundaries have been changed since then.
In general elections, the district is a strong area for parties commonly associated with the red bloc.[8]
General elections results
General elections in the 2020s
| Parties | Vote | |||||
|---|---|---|---|---|---|---|
| Votes | % | + / - | ||||
| Social Democrats | 9,335 | 32.30 | +2.90 | |||
| Green Left | 3,281 | 11.35 | +0.02 | |||
| Moderates | 2,806 | 9.71 | New | |||
| Venstre | 2,330 | 8.06 | -6.89 | |||
| Liberal Alliance | 1,762 | 6.10 | +4.34 | |||
| Red–Green Alliance | 1,590 | 5.50 | -2.40 | |||
| Danish People's Party | 1,358 | 4.70 | -6.21 | |||
| Denmark Democrats | 1,331 | 4.60 | New | |||
| Conservatives | 1,328 | 4.59 | -0.48 | |||
| Social Liberals | 1,231 | 4.26 | -4.56 | |||
| New Right | 906 | 3.13 | +0.75 | |||
| The Alternative | 806 | 2.79 | -0.14 | |||
| Independent Greens | 701 | 2.43 | New | |||
| Christian Democrats | 97 | 0.34 | -0.74 | |||
| Jovan Tasevski | 34 | 0.12 | New | |||
| Henrik Vendelbo Petersen | 8 | 0.03 | New | |||
| Total | 28,904 | |||||
| Source[9] | ||||||
General elections in the 2010s
| Parties | Vote | |||||
|---|---|---|---|---|---|---|
| Votes | % | + / - | ||||
| Social Democrats | 8,886 | 29.40 | -2.43 | |||
| Venstre | 4,518 | 14.95 | +2.68 | |||
| Green Left | 3,424 | 11.33 | +6.26 | |||
| Danish People's Party | 3,298 | 10.91 | -14.47 | |||
| Social Liberals | 2,666 | 8.82 | +5.18 | |||
| Red–Green Alliance | 2,389 | 7.90 | -1.34 | |||
| Conservatives | 1,532 | 5.07 | +2.68 | |||
| The Alternative | 886 | 2.93 | -0.77 | |||
| New Right | 720 | 2.38 | New | |||
| Stram Kurs | 681 | 2.25 | New | |||
| Liberal Alliance | 533 | 1.76 | -3.92 | |||
| Christian Democrats | 326 | 1.08 | +0.64 | |||
| Klaus Riskær Pedersen Party | 258 | 0.85 | New | |||
| Mads Palsvig | 100 | 0.33 | New | |||
| Christian B. Olesen | 7 | 0.02 | New | |||
| Total | 30,224 | |||||
| Source[10] | ||||||
| Parties | Vote | |||||
|---|---|---|---|---|---|---|
| Votes | % | + / - | ||||
| Social Democrats | 9,738 | 31.83 | +3.17 | |||
| Danish People's Party | 7,764 | 25.38 | +8.86 | |||
| Venstre | 3,752 | 12.27 | -6.67 | |||
| Red–Green Alliance | 2,827 | 9.24 | +0.69 | |||
| Liberal Alliance | 1,738 | 5.68 | +1.80 | |||
| Green Left | 1,550 | 5.07 | -5.29 | |||
| The Alternative | 1,132 | 3.70 | New | |||
| Social Liberals | 1,112 | 3.64 | -4.81 | |||
| Conservatives | 730 | 2.39 | -1.80 | |||
| Christian Democrats | 136 | 0.44 | +0.10 | |||
| Asif Ahmad | 104 | 0.34 | New | |||
| Christian Olesen | 7 | 0.02 | New | |||
| Total | 30,590 | |||||
| Source[11] | ||||||
| Parties | Vote | |||||
|---|---|---|---|---|---|---|
| Votes | % | + / - | ||||
| Social Democrats | 8,886 | 28.66 | -2.16 | |||
| Venstre | 5,872 | 18.94 | +1.65 | |||
| Danish People's Party | 5,121 | 16.52 | -2.40 | |||
| Green Left | 3,213 | 10.36 | -4.34 | |||
| Red–Green Alliance | 2,652 | 8.55 | +5.79 | |||
| Social Liberals | 2,620 | 8.45 | +4.23 | |||
| Conservatives | 1,298 | 4.19 | -4.01 | |||
| Liberal Alliance | 1,204 | 3.88 | +1.30 | |||
| Christian Democrats | 106 | 0.34 | -0.16 | |||
| Christian H. Hansen | 31 | 0.10 | New | |||
| Total | 31,003 | |||||
| Source[12] | ||||||
General elections in the 2000s
| Parties | Vote | |||||
|---|---|---|---|---|---|---|
| Votes | % | + / - | ||||
| Social Democrats | 9,371 | 30.82 | -1.00 | |||
| Danish People's Party | 5,751 | 18.92 | -0.36 | |||
| Venstre | 5,255 | 17.29 | -3.09 | |||
| Green Left | 4,468 | 14.70 | +8.04 | |||
| Conservatives | 2,492 | 8.20 | +0.77 | |||
| Social Liberals | 1,282 | 4.22 | -3.66 | |||
| Red–Green Alliance | 840 | 2.76 | -1.54 | |||
| New Alliance | 784 | 2.58 | New | |||
| Christian Democrats | 153 | 0.50 | -0.29 | |||
| Janus Kramer Møller | 5 | 0.02 | New | |||
| Feride Istogu Gillesberg | 1 | 0.00 | New | |||
| Total | 30,402 | |||||
| Source[13] | ||||||
| Parties | Vote | |||||
|---|---|---|---|---|---|---|
| Votes | % | + / - | ||||
| Social Democrats | 15,821 | 31.82 | -4.09 | |||
| Venstre | 10,134 | 20.38 | -2.62 | |||
| Danish People's Party | 9,586 | 19.28 | +1.78 | |||
| Social Liberals | 3,916 | 7.88 | +4.01 | |||
| Conservatives | 3,692 | 7.43 | +1.55 | |||
| Green Left | 3,313 | 6.66 | -0.70 | |||
| Red–Green Alliance | 2,139 | 4.30 | +1.23 | |||
| Centre Democrats | 566 | 1.14 | -0.71 | |||
| Christian Democrats | 392 | 0.79 | -0.43 | |||
| Minority Party | 123 | 0.25 | New | |||
| Nahid Yazdanyar | 37 | 0.07 | New | |||
| Total | 49,719 | |||||
| Source[14] | ||||||
| Parties | Vote | |||||
|---|---|---|---|---|---|---|
| Votes | % | + / - | ||||
| Social Democrats | 18,480 | 35.91 | -7.97 | |||
| Venstre | 11,836 | 23.00 | +8.55 | |||
| Danish People's Party | 9,004 | 17.50 | +5.77 | |||
| Green Left | 3,785 | 7.36 | -1.70 | |||
| Conservatives | 3,028 | 5.88 | -0.92 | |||
| Social Liberals | 1,993 | 3.87 | +1.12 | |||
| Red–Green Alliance | 1,581 | 3.07 | -0.53 | |||
| Centre Democrats | 950 | 1.85 | -2.66 | |||
| Christian People's Party | 627 | 1.22 | +0.12 | |||
| Progress Party | 173 | 0.34 | -1.16 | |||
| Total | 51,457 | |||||
| Source[15] | ||||||
General elections in the 1990s
| Parties | Vote | |||||
|---|---|---|---|---|---|---|
| Votes | % | + / - | ||||
| Social Democrats | 22,178 | 43.88 | +3.06 | |||
| Venstre | 7,302 | 14.45 | +1.27 | |||
| Danish People's Party | 5,927 | 11.73 | New | |||
| Green Left | 4,579 | 9.06 | -0.76 | |||
| Conservatives | 3,435 | 6.80 | -7.15 | |||
| Centre Democrats | 2,281 | 4.51 | +0.64 | |||
| Red–Green Alliance | 1,821 | 3.60 | -1.18 | |||
| Social Liberals | 1,390 | 2.75 | -1.05 | |||
| Progress Party | 758 | 1.50 | -5.73 | |||
| Christian People's Party | 558 | 1.10 | +0.11 | |||
| Democratic Renewal | 166 | 0.33 | New | |||
| Mogens Glistrup | 139 | 0.28 | -0.24 | |||
| Poul Bregninge | 4 | 0.01 | New | |||
| Anders Kofoed | 4 | 0.01 | New | |||
| Total | 50,542 | |||||
| Source[16] | ||||||
| Parties | Vote | |||||
|---|---|---|---|---|---|---|
| Votes | % | + / - | ||||
| Social Democrats | 20,545 | 40.82 | -6.16 | |||
| Conservatives | 7,023 | 13.95 | -0.32 | |||
| Venstre | 6,635 | 13.18 | +7.31 | |||
| Green Left | 4,940 | 9.82 | -0.96 | |||
| Progress Party | 3,640 | 7.23 | +3.05 | |||
| Red–Green Alliance | 2,408 | 4.78 | +2.63 | |||
| Centre Democrats | 1,948 | 3.87 | -3.05 | |||
| Social Liberals | 1,911 | 3.80 | +0.94 | |||
| Christian People's Party | 500 | 0.99 | +0.06 | |||
| Mogens Glistrup | 262 | 0.52 | New | |||
| Preben Møller Hansen | 251 | 0.50 | New | |||
| Niels I. Meyer | 248 | 0.49 | New | |||
| Torben Faber | 8 | 0.02 | New | |||
| John Ziegler | 8 | 0.02 | New | |||
| Total | 50,327 | |||||
| Source[17] | ||||||
| Parties | Vote | |||||
|---|---|---|---|---|---|---|
| Votes | % | + / - | ||||
| Social Democrats | 23,832 | 46.98 | +11.06 | |||
| Conservatives | 7,237 | 14.27 | -1.81 | |||
| Green Left | 5,468 | 10.78 | -9.15 | |||
| Centre Democrats | 3,511 | 6.92 | +1.77 | |||
| Venstre | 2,978 | 5.87 | +2.90 | |||
| Progress Party | 2,119 | 4.18 | -3.32 | |||
| Common Course | 1,792 | 3.53 | +0.55 | |||
| Social Liberals | 1,450 | 2.86 | -2.59 | |||
| Red–Green Alliance | 1,093 | 2.15 | New | |||
| Christian People's Party | 474 | 0.93 | +0.13 | |||
| The Greens | 399 | 0.79 | -0.46 | |||
| Justice Party of Denmark | 363 | 0.72 | New | |||
| Humanist Party | 8 | 0.02 | New | |||
| Total | 50,724 | |||||
| Source[18] | ||||||
General elections in the 1980s
| Parties | Vote | |||||
|---|---|---|---|---|---|---|
| Votes | % | + / - | ||||
| Social Democrats | 19,088 | 35.92 | +4.51 | |||
| Green Left | 10,590 | 19.93 | -3.73 | |||
| Conservatives | 8,546 | 16.08 | -1.10 | |||
| Progress Party | 3,986 | 7.50 | +3.33 | |||
| Social Liberals | 2,896 | 5.45 | -0.37 | |||
| Centre Democrats | 2,736 | 5.15 | -0.75 | |||
| Common Course | 1,585 | 2.98 | -0.79 | |||
| Venstre | 1,576 | 2.97 | +1.00 | |||
| Communist Party of Denmark | 666 | 1.25 | -0.13 | |||
| The Greens | 664 | 1.25 | -0.05 | |||
| Christian People's Party | 423 | 0.80 | -0.17 | |||
| Left Socialists | 376 | 0.71 | -0.83 | |||
| Leif Hilt | 6 | 0.01 | New | |||
| Total | 53,138 | |||||
| Source[19] | ||||||
| Parties | Vote | |||||
|---|---|---|---|---|---|---|
| Votes | % | + / - | ||||
| Social Democrats | 16,468 | 31.41 | -9.15 | |||
| Green Left | 12,406 | 23.66 | +5.84 | |||
| Conservatives | 9,009 | 17.18 | -2.15 | |||
| Centre Democrats | 3,094 | 5.90 | +1.87 | |||
| Social Liberals | 3,051 | 5.82 | +0.72 | |||
| Progress Party | 2,188 | 4.17 | +1.14 | |||
| Common Course | 1,978 | 3.77 | New | |||
| Venstre | 1,032 | 1.97 | -0.87 | |||
| Left Socialists | 806 | 1.54 | -1.42 | |||
| Communist Party of Denmark | 724 | 1.38 | +0.29 | |||
| The Greens | 681 | 1.30 | New | |||
| Christian People's Party | 508 | 0.97 | -0.04 | |||
| Justice Party of Denmark | 318 | 0.61 | -1.50 | |||
| Humanist Party | 109 | 0.21 | New | |||
| Socialist Workers Party | 42 | 0.08 | 0.00 | |||
| Marxist–Leninists Party | 14 | 0.03 | +0.01 | |||
| Carsten Grøn-Nielsen | 2 | 0.00 | -0.01 | |||
| Per Hillersborg | 2 | 0.00 | New | |||
| Total | 52,432 | |||||
| Source[20] | ||||||
| Parties | Vote | |||||
|---|---|---|---|---|---|---|
| Votes | % | + / - | ||||
| Social Democrats | 22,896 | 40.56 | -0.09 | |||
| Conservatives | 10,911 | 19.33 | +6.98 | |||
| Green Left | 10,061 | 17.82 | +0.61 | |||
| Social Liberals | 2,877 | 5.10 | +0.32 | |||
| Centre Democrats | 2,273 | 4.03 | -2.91 | |||
| Progress Party | 1,709 | 3.03 | -4.38 | |||
| Left Socialists | 1,672 | 2.96 | -0.67 | |||
| Venstre | 1,604 | 2.84 | +0.74 | |||
| Justice Party of Denmark | 1,193 | 2.11 | +0.12 | |||
| Communist Party of Denmark | 616 | 1.09 | -0.83 | |||
| Christian People's Party | 569 | 1.01 | +0.25 | |||
| Socialist Workers Party | 45 | 0.08 | 0.00 | |||
| Marxist–Leninists Party | 11 | 0.02 | New | |||
| Carsten Grøn-Nielsen | 5 | 0.01 | New | |||
| Mogens Nebelong | 3 | 0.01 | 0.00 | |||
| Poul Rasmussen | 0 | 0.00 | New | |||
| Total | 56,445 | |||||
| Source[21] | ||||||
| Parties | Vote | |||||
|---|---|---|---|---|---|---|
| Votes | % | + / - | ||||
| Social Democrats | 21,550 | 40.65 | -5.75 | |||
| Green Left | 9,127 | 17.21 | +8.23 | |||
| Conservatives | 6,546 | 12.35 | +2.11 | |||
| Progress Party | 3,926 | 7.41 | -1.04 | |||
| Centre Democrats | 3,681 | 6.94 | +4.08 | |||
| Social Liberals | 2,535 | 4.78 | -0.78 | |||
| Left Socialists | 1,924 | 3.63 | -1.92 | |||
| Venstre | 1,116 | 2.10 | -1.19 | |||
| Justice Party of Denmark | 1,055 | 1.99 | -1.91 | |||
| Communist Party of Denmark | 1,018 | 1.92 | -1.44 | |||
| Christian People's Party | 402 | 0.76 | -0.02 | |||
| Communist Workers Party | 88 | 0.17 | -0.46 | |||
| Socialist Workers Party | 44 | 0.08 | New | |||
| Mogens Nebelong | 6 | 0.01 | New | |||
| Total | 53,018 | |||||
| Source[22] | ||||||
General elections in the 1970s
| Parties | Vote | |||||
|---|---|---|---|---|---|---|
| Votes | % | + / - | ||||
| Social Democrats | 24,858 | 46.40 | +1.04 | |||
| Conservatives | 5,487 | 10.24 | +3.64 | |||
| Green Left | 4,811 | 8.98 | +2.68 | |||
| Progress Party | 4,528 | 8.45 | -3.61 | |||
| Social Liberals | 2,978 | 5.56 | +3.13 | |||
| Left Socialists | 2,974 | 5.55 | +1.57 | |||
| Justice Party of Denmark | 2,091 | 3.90 | -1.09 | |||
| Communist Party of Denmark | 1,799 | 3.36 | -3.17 | |||
| Venstre | 1,761 | 3.29 | +0.24 | |||
| Centre Democrats | 1,534 | 2.86 | -3.87 | |||
| Christian People's Party | 417 | 0.78 | -0.26 | |||
| Communist Workers Party | 337 | 0.63 | New | |||
| Total | 53,575 | |||||
| Source[23] | ||||||
| Parties | Vote | |||||
|---|---|---|---|---|---|---|
| Votes | % | + / - | ||||
| Social Democrats | 23,421 | 45.36 | +10.17 | |||
| Progress Party | 6,229 | 12.06 | -1.96 | |||
| Centre Democrats | 3,474 | 6.73 | +4.21 | |||
| Conservatives | 3,408 | 6.60 | +1.86 | |||
| Communist Party of Denmark | 3,369 | 6.53 | -0.98 | |||
| Green Left | 3,251 | 6.30 | -3.41 | |||
| Justice Party of Denmark | 2,575 | 4.99 | +2.65 | |||
| Left Socialists | 2,055 | 3.98 | +1.31 | |||
| Venstre | 1,574 | 3.05 | -9.05 | |||
| Social Liberals | 1,254 | 2.43 | -3.86 | |||
| Christian People's Party | 539 | 1.04 | -1.86 | |||
| Pensioners' Party | 476 | 0.92 | New | |||
| Otto Jensen | 5 | 0.01 | New | |||
| Poul Rasmussen | 1 | 0.00 | New | |||
| Total | 51,631 | |||||
| Source[24] | ||||||
| Parties | Vote | |||||
|---|---|---|---|---|---|---|
| Votes | % | + / - | ||||
| Social Democrats | 17,693 | 35.19 | +6.38 | |||
| Progress Party | 7,049 | 14.02 | -0.78 | |||
| Venstre | 6,085 | 12.10 | +8.40 | |||
| Green Left | 4,884 | 9.71 | -1.89 | |||
| Communist Party of Denmark | 3,777 | 7.51 | +0.92 | |||
| Social Liberals | 3,161 | 6.29 | -1.90 | |||
| Conservatives | 2,383 | 4.74 | -2.85 | |||
| Christian People's Party | 1,459 | 2.90 | +1.15 | |||
| Left Socialists | 1,343 | 2.67 | +0.48 | |||
| Centre Democrats | 1,266 | 2.52 | -8.73 | |||
| Justice Party of Denmark | 1,174 | 2.34 | -1.17 | |||
| Henning Glahn | 2 | 0.00 | New | |||
| J. G. Amdrejcak | 1 | 0.00 | New | |||
| Kai Clemmensen | 1 | 0.00 | New | |||
| Poul Friborg | 0 | 0.00 | New | |||
| Total | 50,278 | |||||
| Source[25] | ||||||
| Parties | Vote | |||||
|---|---|---|---|---|---|---|
| Votes | % | + / - | ||||
| Social Democrats | 13,074 | 28.81 | -13.99 | |||
| Progress Party | 6,716 | 14.80 | New | |||
| Green Left | 5,262 | 11.60 | -4.63 | |||
| Centre Democrats | 5,103 | 11.25 | New | |||
| Social Liberals | 3,718 | 8.19 | -4.15 | |||
| Conservatives | 3,445 | 7.59 | -9.33 | |||
| Communist Party of Denmark | 2,992 | 6.59 | +4.16 | |||
| Venstre | 1,680 | 3.70 | -0.70 | |||
| Justice Party of Denmark | 1,593 | 3.51 | +1.80 | |||
| Left Socialists | 993 | 2.19 | -0.01 | |||
| Christian People's Party | 793 | 1.75 | +1.02 | |||
| Erik Dissing | 11 | 0.02 | New | |||
| Total | 45,380 | |||||
| Source[26] | ||||||
| Parties | Vote | |||||
|---|---|---|---|---|---|---|
| Votes | % | + / - | ||||
| Social Democrats | 18,347 | 42.80 | +6.73 | |||
| Conservatives | 7,252 | 16.92 | -5.76 | |||
| Green Left | 6,959 | 16.23 | +5.37 | |||
| Social Liberals | 5,291 | 12.34 | -5.05 | |||
| Venstre | 1,887 | 4.40 | +0.11 | |||
| Communist Party of Denmark | 1,042 | 2.43 | +0.51 | |||
| Left Socialists | 943 | 2.20 | -1.87 | |||
| Justice Party of Denmark | 731 | 1.71 | +1.26 | |||
| Christian People's Party | 314 | 0.73 | New | |||
| Henning Berthelsen | 103 | 0.24 | New | |||
| Total | 42,869 | |||||
| Source[27] | ||||||
General elections in the 1960s
| Parties | Vote | |||||
|---|---|---|---|---|---|---|
| Votes | % | + / - | ||||
| Social Democrats | 15,488 | 36.07 | +1.56 | |||
| Conservatives | 9,736 | 22.68 | -7.96 | |||
| Social Liberals | 7,468 | 17.39 | +11.16 | |||
| Green Left | 4,664 | 10.86 | -6.55 | |||
| Venstre | 1,842 | 4.29 | -0.73 | |||
| Left Socialists | 1,747 | 4.07 | New | |||
| Liberal Centre | 878 | 2.04 | -2.00 | |||
| Communist Party of Denmark | 823 | 1.92 | +0.68 | |||
| Justice Party of Denmark | 194 | 0.45 | +0.12 | |||
| Independent Party | 95 | 0.22 | -0.36 | |||
| H. Søndersted Andersen | 4 | 0.01 | New | |||
| Kirsten Lonning | 4 | 0.01 | New | |||
| Thode Karlsen | 1 | 0.00 | -0.01 | |||
| Total | 42,935 | |||||
| Source[28] | ||||||
| Parties | Vote | |||||
|---|---|---|---|---|---|---|
| Votes | % | + / - | ||||
| Social Democrats | 16,298 | 34.51 | -11.11 | |||
| Conservatives | 14,471 | 30.64 | +5.62 | |||
| Green Left | 8,224 | 17.41 | +7.04 | |||
| Social Liberals | 2,941 | 6.23 | +2.00 | |||
| Venstre | 2,370 | 5.02 | -4.15 | |||
| Liberal Centre | 1,908 | 4.04 | New | |||
| Communist Party of Denmark | 585 | 1.24 | -0.95 | |||
| Independent Party | 275 | 0.58 | -1.11 | |||
| Justice Party of Denmark | 157 | 0.33 | -0.60 | |||
| Thode Karlsen | 3 | 0.01 | New | |||
| Total | 47,232 | |||||
| Source[29] | ||||||
| Parties | Vote | |||||
|---|---|---|---|---|---|---|
| Votes | % | + / - | ||||
| Social Democrats | 28,115 | 45.62 | -1.83 | |||
| Conservatives | 15,418 | 25.02 | +2.53 | |||
| Green Left | 6,389 | 10.37 | -1.26 | |||
| Venstre | 5,650 | 9.17 | +1.19 | |||
| Social Liberals | 2,608 | 4.23 | -0.36 | |||
| Communist Party of Denmark | 1,347 | 2.19 | +0.26 | |||
| Independent Party | 1,043 | 1.69 | -0.49 | |||
| Justice Party of Denmark | 574 | 0.93 | -0.81 | |||
| Peace Politics People's Party | 269 | 0.44 | New | |||
| Danish Unity | 190 | 0.31 | New | |||
| Elin Høgsbro Appel | 29 | 0.05 | New | |||
| Total | 61,632 | |||||
| Source[30] | ||||||
| Parties | Vote | |||||
|---|---|---|---|---|---|---|
| Votes | % | + / - | ||||
| Social Democrats | 24,521 | 47.45 | +1.39 | |||
| Conservatives | 11,625 | 22.49 | +1.20 | |||
| Green Left | 6,012 | 11.63 | New | |||
| Venstre | 4,124 | 7.98 | -2.92 | |||
| Social Liberals | 2,373 | 4.59 | -3.49 | |||
| Independent Party | 1,129 | 2.18 | +0.66 | |||
| Communist Party of Denmark | 999 | 1.93 | -4.29 | |||
| Justice Party of Denmark | 900 | 1.74 | -4.19 | |||
| Total | 51,683 | |||||
| Source[31] | ||||||
General elections in the 1950s
| Parties | Vote | |||||
|---|---|---|---|---|---|---|
| Votes | % | + / - | ||||
| Social Democrats | 18,029 | 46.06 | -2.94 | |||
| Conservatives | 8,332 | 21.29 | +0.75 | |||
| Venstre | 4,268 | 10.90 | +3.71 | |||
| Social Liberals | 3,164 | 8.08 | -0.11 | |||
| Communist Party of Denmark | 2,436 | 6.22 | -3.16 | |||
| Justice Party of Denmark | 2,320 | 5.93 | +1.88 | |||
| Independent Party | 595 | 1.52 | -0.12 | |||
| Total | 39,144 | |||||
| Source[32] | ||||||
September 1953 Danish Folketing election
| Parties | Vote | |||||
|---|---|---|---|---|---|---|
| Votes | % | + / - | ||||
| Social Democrats | 13,976 | 49.00 | ||||
| Conservatives | 5,860 | 20.54 | ||||
| Communist Party of Denmark | 2,676 | 9.38 | ||||
| Social Liberals | 2,335 | 8.19 | ||||
| Venstre | 2,051 | 7.19 | ||||
| Justice Party of Denmark | 1,156 | 4.05 | ||||
| Independent Party | 469 | 1.64 | ||||
| Total | 28,523 | |||||
| Source[33] | ||||||
European Parliament elections results
2019 European Parliament election in Denmark
| Parties | Vote | |||||
|---|---|---|---|---|---|---|
| Votes | % | + / - | ||||
| Social Democrats | 5,572 | 24.43 | +2.10 | |||
| Green Left | 3,716 | 16.29 | +5.05 | |||
| Venstre | 3,123 | 13.69 | +4.72 | |||
| Danish People's Party | 2,971 | 13.02 | -21.14 | |||
| Social Liberals | 2,470 | 10.83 | +5.71 | |||
| Red–Green Alliance | 1,631 | 7.15 | New | |||
| Conservatives | 1,161 | 5.09 | -1.25 | |||
| People's Movement against the EU | 1,145 | 5.02 | -4.72 | |||
| The Alternative | 719 | 3.15 | New | |||
| Liberal Alliance | 303 | 1.33 | -0.77 | |||
| Total | 22,811 | |||||
| Source[34] | ||||||
2014 European Parliament election in Denmark
| Parties | Vote | |||||
|---|---|---|---|---|---|---|
| Votes | % | + / - | ||||
| Danish People's Party | 6,587 | 34.16 | +12.47 | |||
| Social Democrats | 4,305 | 22.33 | -1.73 | |||
| Green Left | 2,167 | 11.24 | -5.73 | |||
| People's Movement against the EU | 1,879 | 9.74 | -1.64 | |||
| Venstre | 1,729 | 8.97 | -3.06 | |||
| Conservatives | 1,223 | 6.34 | -1.08 | |||
| Social Liberals | 987 | 5.12 | +1.74 | |||
| Liberal Alliance | 405 | 2.10 | +1.55 | |||
| Total | 19,282 | |||||
| Source[35] | ||||||
2009 European Parliament election in Denmark
| Parties | Vote | |||||
|---|---|---|---|---|---|---|
| Votes | % | + / - | ||||
| Social Democrats | 4,719 | 24.06 | -14.91 | |||
| Danish People's Party | 4,253 | 21.69 | +11.55 | |||
| Green Left | 3,327 | 16.97 | +8.36 | |||
| Venstre | 2,359 | 12.03 | +2.26 | |||
| People's Movement against the EU | 2,232 | 11.38 | +2.68 | |||
| Conservatives | 1,456 | 7.42 | -1.45 | |||
| Social Liberals | 663 | 3.38 | -0.93 | |||
| June Movement | 494 | 2.52 | -7.43 | |||
| Liberal Alliance | 107 | 0.55 | New | |||
| Total | 19,610 | |||||
| Source[36] | ||||||
2004 European Parliament election in Denmark
| Parties | Vote | |||||
|---|---|---|---|---|---|---|
| Votes | % | + / - | ||||
| Social Democrats | 10,319 | 38.97 | +20.13 | |||
| Danish People's Party | 2,685 | 10.14 | +0.59 | |||
| June Movement | 2,634 | 9.95 | -10.22 | |||
| Venstre | 2,588 | 9.77 | -3.27 | |||
| Conservatives | 2,348 | 8.87 | +2.40 | |||
| People's Movement against the EU | 2,303 | 8.70 | -1.96 | |||
| Green Left | 2,280 | 8.61 | -0.32 | |||
| Social Liberals | 1,140 | 4.31 | -3.56 | |||
| Christian Democrats | 182 | 0.69 | -0.55 | |||
| Total | 26,479 | |||||
| Source[37] | ||||||
1999 European Parliament election in Denmark
| Parties | Vote | |||||
|---|---|---|---|---|---|---|
| Votes | % | + / - | ||||
| June Movement | 5,698 | 20.17 | -0.25 | |||
| Social Democrats | 5,321 | 18.84 | -0.92 | |||
| Venstre | 3,684 | 13.04 | +3.91 | |||
| People's Movement against the EU | 3,010 | 10.66 | -4.52 | |||
| Danish People's Party | 2,696 | 9.55 | New | |||
| Green Left | 2,523 | 8.93 | -0.80 | |||
| Social Liberals | 2,224 | 7.87 | -0.03 | |||
| Conservatives | 1,827 | 6.47 | -7.21 | |||
| Centre Democrats | 911 | 3.23 | +2.25 | |||
| Christian Democrats | 350 | 1.24 | +0.80 | |||
| Progress Party | 131 | 0.46 | -2.32 | |||
| Total | 28,244 | |||||
| Source[38] | ||||||
1994 European Parliament election in Denmark
| Parties | Vote | |||||
|---|---|---|---|---|---|---|
| Votes | % | + / - | ||||
| June Movement | 6,377 | 20.42 | New | |||
| Social Democrats | 6,169 | 19.76 | -8.71 | |||
| People's Movement against the EU | 4,739 | 15.18 | -14.68 | |||
| Conservatives | 4,271 | 13.68 | +4.19 | |||
| Green Left | 3,037 | 9.73 | -2.97 | |||
| Venstre | 2,851 | 9.13 | +2.89 | |||
| Social Liberals | 2,465 | 7.90 | +6.05 | |||
| Progress Party | 868 | 2.78 | -1.18 | |||
| Centre Democrats | 307 | 0.98 | -5.33 | |||
| Christian Democrats | 138 | 0.44 | -0.68 | |||
| Total | 31,222 | |||||
| Source[39] | ||||||
1989 European Parliament election in Denmark
| Parties | Vote | |||||
|---|---|---|---|---|---|---|
| Votes | % | + / - | ||||
| People's Movement against the EU | 8,551 | 29.86 | -1.22 | |||
| Social Democrats | 8,155 | 28.47 | +5.55 | |||
| Green Left | 3,638 | 12.70 | -3.03 | |||
| Conservatives | 2,717 | 9.49 | -5.52 | |||
| Centre Democrats | 1,808 | 6.31 | +1.08 | |||
| Venstre | 1,787 | 6.24 | +3.95 | |||
| Progress Party | 1,134 | 3.96 | +0.73 | |||
| Social Liberals | 529 | 1.85 | -0.22 | |||
| Christian Democrats | 321 | 1.12 | +0.01 | |||
| Total | 28,640 | |||||
| Source[40] | ||||||
1984 European Parliament election in Denmark
| Parties | Vote | |||||
|---|---|---|---|---|---|---|
| Votes | % | |||||
| People's Movement against the EU | 10,172 | 31.08 | ||||
| Social Democrats | 7,501 | 22.92 | ||||
| Green Left | 5,148 | 15.73 | ||||
| Conservatives | 4,911 | 15.01 | ||||
| Centre Democrats | 1,710 | 5.23 | ||||
| Progress Party | 1,058 | 3.23 | ||||
| Venstre | 749 | 2.29 | ||||
| Social Liberals | 677 | 2.07 | ||||
| Left Socialists | 438 | 1.34 | ||||
| Christian Democrats | 363 | 1.11 | ||||
| Total | 32,727 | |||||
| Source[41] | ||||||
Referendums
2022 Danish European Union opt-out referendum[42]
| Option | Votes | % |
|---|---|---|
| ✓ YES | 14,015 | 62.92 |
| X NO | 8,260 | 37.08 |
2015 Danish European Union opt-out referendum[43]
| Option | Votes | % |
|---|---|---|
| X NO | 15,391 | 60.86 |
| ✓ YES | 9,897 | 39.14 |
2014 Danish Unified Patent Court membership referendum[44]
| Option | Votes | % |
|---|---|---|
| ✓ YES | 10,211 | 54.21 |
| X NO | 8,625 | 45.79 |
2009 Danish Act of Succession referendum[45]
| Option | Votes | % |
|---|---|---|
| ✓ YES | 14,720 | 82.52 |
| X NO | 3,118 | 17.48 |
2000 Danish euro referendum[46]
| Option | Votes | % |
|---|---|---|
| X NO | 32,035 | 61.92 |
| ✓ YES | 19,705 | 38.08 |
1998 Danish Amsterdam Treaty referendum[47]
| Option | Votes | % |
|---|---|---|
| X NO | 24,886 | 55.83 |
| ✓ YES | 19,688 | 44.17 |
1993 Danish Maastricht Treaty referendum[48]
| Option | Votes | % |
|---|---|---|
| X NO | 28,725 | 53.83 |
| ✓ YES | 24,638 | 46.17 |
1992 Danish Maastricht Treaty referendum[49]
| Option | Votes | % |
|---|---|---|
| X NO | 31,702 | 60.92 |
| ✓ YES | 20,333 | 39.08 |
1986 Danish Single European Act referendum[50]
| Option | Votes | % |
|---|---|---|
| X NO | 29,977 | 62.57 |
| ✓ YES | 17,930 | 37.43 |
1972 Danish European Communities membership referendum[51]
| Option | Votes | % |
|---|---|---|
| ✓ YES | 23,169 | 50.14 |
| X NO | 23,041 | 49.86 |
References
- ↑ "Hvidovrekredsen". kmdvalg.dk (in Danish). Retrieved 2023-06-08.
- ↑ "Forslag til Lov om Valg til Rigsdagen". Rigsdagstidende. 1952-53 (første samling): Tillæg C, spalte 225 ff.
- ↑ "Nye valgkredse fordeler stemmerne anderledes". dr.dk (in Danish). Retrieved 2023-06-08.
- ↑ "Beretning om nye valgkredse som følge af kommunalreformen" (in Danish). Retrieved 2023-06-08.
- ↑ "Det danske valgsystem: Valg til Folketinget". valg.im (in Danish). Retrieved 2023-06-08.
- ↑ "17 Hvidovre". dataforsyningen.dk (in Danish). Retrieved 2023-06-08.
- ↑ "Forslag til Lov om Valg til Rigsdagen". Rigsdagstidende. 1952-53 (første samling): Tillæg C, spalte 225 ff.
- ↑ "Valgresultater fra tidligere valg:". kmdvalg (in Danish). Retrieved 2023-06-08.
- ↑ "FOLKETINGSVALG TIRSDAG 1. NOVEMBER 2022". valg.im (in Danish). Retrieved 2023-06-27.
- ↑ "FOLKETINGSVALG ONSDAG 5. JUNI 2019". valg.im (in Danish). Retrieved 2023-06-27.
- ↑ "FOLKETINGSVALG TORSDAG 18. JUNI 2015". valg.im (in Danish). Retrieved 2023-06-27.
- ↑ "FOLKETINGSVALG TORSDAG 15. SEPTEMBER 2011". valg.im (in Danish). Retrieved 2023-06-27.
- ↑ "Folketingsvalget den 13. november 2007". valg.im (in Danish). Retrieved 2023-06-27.
- ↑ "valg2005.book" (PDF). valg.im (in Danish). Retrieved 2023-06-27.
- ↑ "BMTABEL" (PDF). valg.im (in Danish). Retrieved 2023-06-27.
- ↑ "VALG98" (PDF). valg.im (in Danish). Retrieved 2023-06-27.
- ↑ "VALG94" (PDF). valg.im (in Danish). Retrieved 2023-06-27.
- ↑ "VALG90" (PDF). valg.im (in Danish). Retrieved 2023-06-27.
- ↑ "Folketingsvalget den 10. maj 1988". valg.im (in Danish). Retrieved 2023-06-27.
- ↑ "Folketingsvalget den 8.september 1987". dst.dk (in Danish). Retrieved 2023-06-27.
- ↑ "Folketingsvalget den 10. januar 1984". dst.dk (in Danish). Retrieved 2023-06-27.
- ↑ "Folketingsvalget den 8. december 1981". dst.dk (in Danish). Retrieved 2023-06-27.
- ↑ "Folketingsvalget den 23. oktober 1979". dst.dk (in Danish). Retrieved 2023-06-27.
- ↑ "Folketingsvalget den 15. februar 1977". dst.dk (in Danish). Retrieved 2023-06-27.
- ↑ "Folketingsvalget den 9. januar 1975". dst.dk (in Danish). Retrieved 2023-06-27.
- ↑ "Folketingsvalget den 4. december 1973". dst.dk (in Danish). Retrieved 2023-06-27.
- ↑ "Folketingsvalget den 21. september 1971 samt folkeafstemningen". dst.dk (in Danish). Retrieved 2023-06-27.
- ↑ "Folketingsvalget den 23. januar 1968". dst.dk (in Danish). Retrieved 2023-06-27.
- ↑ "Folketingsvalget den 22. november 1966". dst.dk (in Danish). Retrieved 2023-06-27.
- ↑ "Folketingsvalget den 22. september 1964". dst.dk (in Danish). Retrieved 2023-06-27.
- ↑ "Folketingsvalget den 15. november 1960". dst.dk (in Danish). Retrieved 2023-06-27.
- ↑ "Folketingsvalget den 14. maj 1957". dst.dk (in Danish). Retrieved 2023-06-27.
- ↑ "Folketingsvalget den 22. september 1953". dst.dk (in Danish). Retrieved 2023-06-27.
- ↑ "EUROPA-PARLAMENTSVALG SØNDAG 26. MAJ 2019". dst.dk (in Danish). Retrieved 2023-07-01.
- ↑ "EUROPA-PARLAMENTSVALG SØNDAG 25. MAJ 2014". dst.dk (in Danish). Retrieved 2023-07-01.
- ↑ "EUROPA-PARLAMENTSVALG SØNDAG 7. JUNI 2009". dst.dk (in Danish). Retrieved 2023-07-01.
- ↑ "EUROPA-PARLAMENTSVALGET DEN 13. JUNI 2004" (PDF). im.dk (in Danish). Retrieved 2023-07-01.
- ↑ "VALGET TIL EUROPA-PARLAMENTET DEN 10. JUNI 1999" (PDF). im.dk (in Danish). Retrieved 2023-07-01.
- ↑ "VALGET TIL EUROPA-PARLAMENTET DEN 9. JUNI 1994" (PDF). im.dk (in Danish). Retrieved 2023-07-01.
- ↑ "Valget til Europa-parlamentet den 15. juni 1989". dst.dk (in Danish). Retrieved 2023-07-01.
- ↑ "Valget til Europa-Parlamentet den 14. juni 1984". dst.dk (in Danish). Retrieved 2023-07-01.
- ↑ "FOLKEAFSTEMNING ONSDAG 1. JUNI 2022". dst.dk (in Danish). Retrieved 2023-07-05.
- ↑ "FOLKEAFSTEMNING TORSDAG 3. DECEMBER 2015". dst.dk (in Danish). Retrieved 2023-07-05.
- ↑ "FOLKEAFSTEMNING SØNDAG 25. MAJ 2014". dst.dk (in Danish). Retrieved 2023-07-05.
- ↑ "FOLKEAFSTEMNING SØNDAG 7. JUNI 2009". dst.dk (in Danish). Retrieved 2023-07-05.
- ↑ "FOLKEAFSTEMNINGEN DEN 28. SEPTEMBER 2000 OM DANMARKS DELTAGELSE I DEN FÆLLES VALUTA" (PDF). valg.im (in Danish). Retrieved 2023-07-05.
- ↑ "FOLKEAFSTEMNINGEN DEN 28. MAJ 1998OM DANMARKS TILTRÆDELSE AF AMSTERDAMTRAKTATEN" (PDF). valg.im (in Danish). Retrieved 2023-07-05.
- ↑ "FOLKEAFSTEMNINGEN DEN 18. MAJ 1993 OM DANMARKS TILTRÆDELSE AF EDINBURGH-AFGØRELSEN OG MAASTRICHT-TRAKTATEN". dst.dk (in Danish). Retrieved 2023-07-05.
- ↑ "Folkeafstemningen den 1. juni 1992 om Danmarks tiltrædelse af traktaten om Den Europæiske Union". dst.dk (in Danish). Retrieved 2023-07-05.
- ↑ "Vejledende folkeafstemning torsdag den 27. februar 1986 om Danmarks tiltrædelse af EF- pakken". dst.dk (in Danish). Retrieved 2023-07-05.
- ↑ "Folkeafstemningen om Danmarks tiltrædelse af De europæiske Fælleskaber 2. oktober 1972". dst.dk (in Danish). Retrieved 2023-07-05.