| ||||||||||||||||||||||||||
| ||||||||||||||||||||||||||
 County Results
| ||||||||||||||||||||||||||
| ||||||||||||||||||||||||||


| Elections in Idaho |
|---|
 |
2012 U.S. presidential election | |
|---|---|
| Democratic Party | |
| Republican Party | |
| Related races | |
| |
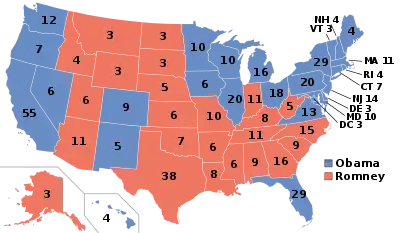
The 2012 United States presidential election in Idaho took place on November 6, 2012, as part of the 2012 United States presidential election in which all 50 states plus the District of Columbia participated. Idaho voters chose four electors to represent them in the Electoral College via a popular vote pitting incumbent Democratic President Barack Obama and his running mate, Vice President Joe Biden, against Republican challenger and former Massachusetts Governor Mitt Romney and his running mate, Congressman Paul Ryan. Prior to the election, 17 news organizations considered this a state Romney would win, or otherwise considered as a safe red state. Romney and Ryan carried Idaho with 64.09% of the popular vote to Obama's and Biden's 32.40%, thus winning the state's four electoral votes.[1] Romney's victory in Idaho made it his fourth strongest state in the 2012 election after Utah, Wyoming and Oklahoma.[2] He improved on McCain's performance in 2008, expanding his margin from 25.3% to 31.69% and flipping Teton County which had previously voted for Obama.
Caucuses
Democratic caucuses
President Obama ran unopposed in the caucuses. The District cast all 31 of its delegate votes at the 2012 Democratic National Convention for Obama.[3]
| 2012 Idaho Democratic presidential primary[4] | |||
|---|---|---|---|
| Candidate | State convention delegates | Percentage | Delegates |
| Barack Obama | 1,400 | 100% | 27 |
| Unpledged delegates: | 4 | ||
| Total: | 1,400 | 100% | 31 |
Republican caucuses
| |||||||||||||||||||||||||
| |||||||||||||||||||||||||
 Idaho results by county
Mitt Romney
Rick Santorum
Ron Paul | |||||||||||||||||||||||||

.jpg.webp)
The Republican caucuses took place on Super Tuesday, March 6, 2012.[5][6] An advisory primary with no binding effect on delegates, scheduled to be held on Tuesday May 15, 2012, was cancelled by the Idaho Republican Party.[7] Five candidates were on the ballot. In order of filing they are Ron Paul, Mitt Romney, Rick Santorum, Newt Gingrich, and Buddy Roemer. Although Roemer had withdrawn from the Republican race before the Idaho caucus, he still appeared on the ballot.[8]
Idaho has 32 delegates to the Republican national convention, of which 3 are RNC and 29 are AL. The 3 RNC delegates pledged to go with the results of the Boise Straw Poll. The delegates will be determined by the caucuses results, based on a two-step approach. First, the delegates are primarily awarded winner-take-all by county after a series of votes in which candidates are successively removed from the ballot. Then, if a candidate receives half or more of the county delegates, he will receive all the 32 delegates; if not, the delegates will be split proportionately according to the number of county delegates.[9] Mitt Romney won 61% of the vote, thanks to a large majority of support (80-90% in most counties) in majority Mormon southeastern Idaho, rendering it a winner-take-all contest. Santorum and Paul split the Panhandle, winning five counties each, but came away empty in the delegate count.
Straw polls
Despite a complete lack of formal polling in the state,[9] there were a total of five straw polls conducted in Idaho, three of which were online. Ron Paul won three of these,[10][11][12] while Mitt Romney won two.[13]
January 2–4 online poll
This was the first ever Idaho straw poll.[14] It was conducted entirely online by Kaz Wittig KStar Enterprises. Ron Paul won with over 70% of the vote.[10]
| Finish | Candidate | Percentage |
|---|---|---|
| 1 | Ron Paul | 73.53% |
| 2 | Rick Santorum | 8.09% |
| 3 | Newt Gingrich | 7.35% |
| 4 | Mitt Romney | 5.15% |
| 5 | Barack Obama | 3.68% |
| 6 | Gary Johnson | 1.47% |
| 7 | Rick Perry | 0.74% |
| 8 | Jon Huntsman | 0.00% |
| 9 | Michele Bachmann | 0.00% |
| Total | 100% |
January 6 Boise poll
This poll used paper ballots and was conducted in Boise. Ron Paul won this poll. Rick Perry's campaign, although still active in the race at this time, did not participate.[11]
| Finish | Candidate | Percentage | Votes |
|---|---|---|---|
| 1 | Ron Paul | 43% | 173 |
| 2 | Mitt Romney | 34% | 135 |
| 3 | Newt Gingrich | 12% | 47 |
| 4 | Rick Santorum | 10% | 40 |
| 5 | Jon Huntsman | 1% | 4 |
| Total | 100% | 399 |
February 2–4 online poll
This online straw poll was also produced by Kaz Wittig KStar Enterprises. Mitt Romney won the poll by a small margin.[13]
| Finish | Candidate | Percentage |
|---|---|---|
| 1 | Mitt Romney | 45.39% |
| 2 | Ron Paul | 42.70% |
| 3 | Rick Santorum | 4.49% |
| 4 | Newt Gingrich | 3.82% |
| 5 | Barack Obama | 3.15% |
| 6 | Other | 0.45% |
| Total | 100% |
March 1–3 online poll
This poll was also produced by Kaz Wittig KStar Enterprises. Ron Paul won by a double-digit margin.[12]
| Finish | Candidate | Percentage | Votes |
|---|---|---|---|
| 1 | Ron Paul | 51.37% | 525 |
| 2 | Mitt Romney | 35.03% | 358 |
| 3 | Gary Johnson | 3.91% | 40 |
| 4 | Rick Santorum | 3.23% | 33 |
| 5 | Virgil Goode | 2.84% | 29 |
| 6 | Buddy Roemer | 1.96% | 20 |
| 7 | Newt Gingrich | 0.98% | 10 |
| 8 | Barack Obama | 0.49% | 5 |
| 9 | Other | 0.2% | 2 |
| Total | 100% | 1022 |
Results
| Finish | Candidate | Percentage | Votes | Estimated National Delegates |
|---|---|---|---|---|
| 1 | Mitt Romney | 61.6% | 27,514 | 32 |
| 2 | Rick Santorum | 18.2% | 8,115 | 0 |
| 3 | Ron Paul | 18.1% | 8,086 | 0 |
| 4 | Newt Gingrich | 2.1% | 940 | 0 |
| 5 | Buddy Roemer | 0.0% | 17 | 0 |
| Total | 100% | 32 |
County totals
| County | Newt Gingrich | Ron Paul | Mitt Romney | Rick Santorum | Total | Winner |
|---|---|---|---|---|---|---|
| Ada | 307 | 1766 | 4233 | 1866 | 8172 | Romney |
| Adams | 0 | 85 | 132 | 0 | 217 | Romney |
| Bannock | 24 | 254 | 1614 | 146 | 2038 | Romney |
| Bear Lake | 2 | 15 | 308 | 19 | 344 | Romney |
| Benewah | 24 | 90 | 26 | 145 | 265 | Santorum |
| Bingham | 27 | 215 | 2172 | 150 | 2564 | Romney |
| Blaine | 47 | 79 | 230 | 23 | 379 | Romney |
| Boise | 0 | 128 | 163 | 0 | 291 | Romney |
| Bonner | 0 | 555 | 0 | 487 | 1042 | Paul |
| Bonneville | 65 | 481 | 3044 | 235 | 3825 | Romney |
| Boundary | 0 | 193 | 64 | 101 | 358 | Paul |
| Butte | 10 | 25 | 153 | 23 | 211 | Romney |
| Camas | 0 | 40 | 38 | 0 | 78 | Paul |
| Canyon | 0 | 617 | 2056 | 1296 | 3969 | Romney |
| Caribou | 7 | 22 | 336 | 26 | 391 | Romney |
| Cassia | 28 | 143 | 1279 | 144 | 1594 | Romney |
| Clark | 2 | 8 | 88 | 17 | 115 | Romney |
| Clearwater | 0 | 85 | 0 | 151 | 236 | Santorum |
| Custer | 19 | 48 | 98 | 24 | 189 | Romney |
| Elmore | 0 | 158 | 281 | 0 | 439 | Romney |
| Franklin | 4 | 105 | 856 | 29 | 994 | Romney |
| Fremont | 12 | 76 | 726 | 38 | 852 | Romney |
| Gem | 0 | 150 | 379 | 143 | 672 | Romney |
| Gooding | 47 | 84 | 299 | 86 | 516 | Romney |
| Idaho | 0 | 284 | 0 | 191 | 475 | Paul |
| Jefferson | 11 | 212 | 1642 | 114 | 1979 | Romney |
| Jerome | 28 | 74 | 331 | 101 | 534 | Romney |
| Kootenai | 0 | 496 | 0 | 674 | 1170 | Santorum |
| Latah | 78 | 509 | 197 | 188 | 972 | Paul |
| Lemhi | 44 | 60 | 217 | 64 | 385 | Romney |
| Lewis | 0 | 0 | 25 | 44 | 69 | Santorum |
| Lincoln | 14 | 11 | 147 | 49 | 221 | Romney |
| Madison | 7 | 260 | 2510 | 50 | 2827 | Romney |
| Minidoka | 22 | 80 | 653 | 92 | 847 | Romney |
| Nez Perce | 0 | 127 | 124 | 0 | 251 | Paul |
| Oneida | 3 | 39 | 241 | 18 | 301 | Romney |
| Owyhee | 0 | 0 | 177 | 263 | 440 | Santorum |
| Payette | 0 | 0 | 428 | 302 | 730 | Romney |
| Power | 9 | 13 | 287 | 38 | 347 | Romney |
| Shoshone | 0 | 0 | 63 | 74 | 137 | Santorum |
| Teton | 13 | 44 | 295 | 26 | 378 | Romney |
| Twin Falls | 83 | 332 | 1228 | 409 | 2052 | Romney |
| Valley | 0 | 123 | 152 | 0 | 275 | Romney |
| Washington | 0 | 0 | 222 | 269 | 491 | Santorum |
Notes
- That these totals reflect the final caucus ballots in each county; where only two candidates have votes totaled, this was likely from other candidates being eliminated in previous rounds of voting. Where all candidates have at least one vote, only one ballot was necessary, since the winning candidate had a majority of votes in that county.
- Vote totals for Buddy Roemer, who had formally withdrawn from the Republican race before the caucus, are not provided.
General election
Candidate ballot access
Results
| 2012 United States presidential election in Idaho[17] | ||||||
|---|---|---|---|---|---|---|
| Party | Candidate | Running mate | Votes | Percentage | Electoral votes | |
| Republican | Mitt Romney | Paul Ryan | 420,911 | 64.09% | 4 | |
| Democratic | Barack Obama | Joe Biden | 212,787 | 32.40% | 0 | |
| Libertarian | Gary Johnson | Jim Gray | 9,453 | 1.44% | 0 | |
| Write-Ins | Write-Ins | 4,429 | 0.67% | 0 | ||
| Green | Jill Stein | Cheri Honkala | 4,402 | 0.67% | 0 | |
| Justice | Rocky Anderson | Luis J. Rodriguez | 2,499 | 0.38% | 0 | |
| Constitution | Virgil Goode | Jim Clymer | 2,222 | 0.34% | 0 | |
| Peace & Freedom | Roseanne Barr | Cindy Sheehan | 39 | 0.01% | 0 | |
| Totals | 656,742 | 100.00% | 4 | |||
By county
| County | Mitt Romney Republican |
Barack Obama Democratic |
Various candidates Other parties |
Margin | Total | ||||
|---|---|---|---|---|---|---|---|---|---|
| # | % | # | % | # | % | # | % | ||
| Ada | 97,554 | 53.53% | 77,137 | 42.33% | 7,555 | 4.14% | 20,417 | 11.20% | 182,246 |
| Adams | 1,413 | 68.56% | 577 | 28.00% | 71 | 3.44% | 836 | 40.56% | 2,061 |
| Bannock | 21,010 | 59.14% | 13,214 | 37.20% | 1,299 | 3.66% | 7,796 | 21.94% | 35,523 |
| Bear Lake | 2,489 | 88.20% | 302 | 10.70% | 31 | 1.10% | 2,187 | 77.50% | 2,822 |
| Benewah | 2,596 | 66.82% | 1,164 | 29.96% | 125 | 3.22% | 1,432 | 36.86% | 3,885 |
| Bingham | 13,440 | 76.03% | 3,822 | 21.62% | 416 | 2.35% | 9,618 | 54.41% | 17,678 |
| Blaine | 3,939 | 38.64% | 5,992 | 58.78% | 263 | 2.58% | -2,053 | -20.14% | 10,194 |
| Boise | 2,284 | 66.28% | 1,053 | 30.56% | 109 | 3.16% | 1,231 | 35.72% | 3,446 |
| Bonner | 11,367 | 60.45% | 6,500 | 34.57% | 936 | 4.98% | 4,867 | 25.88% | 18,803 |
| Bonneville | 32,276 | 74.68% | 9,903 | 22.91% | 1,038 | 2.41% | 22,373 | 51.77% | 43,217 |
| Boundary | 3,138 | 69.06% | 1,225 | 26.96% | 181 | 3.98% | 1,913 | 42.10% | 4,544 |
| Butte | 1,001 | 77.84% | 258 | 20.06% | 27 | 2.10% | 743 | 57.78% | 1,286 |
| Camas | 402 | 69.55% | 159 | 27.51% | 17 | 2.94% | 243 | 42.04% | 578 |
| Canyon | 44,369 | 66.47% | 19,866 | 29.76% | 2,512 | 3.77% | 24,503 | 36.71% | 66,747 |
| Caribou | 2,608 | 85.45% | 386 | 12.65% | 58 | 1.90% | 2,222 | 72.80% | 3,052 |
| Cassia | 7,154 | 84.84% | 1,098 | 13.02% | 180 | 2.14% | 6,056 | 71.82% | 8,432 |
| Clark | 235 | 71.65% | 66 | 20.12% | 27 | 8.23% | 169 | 51.53% | 328 |
| Clearwater | 2,541 | 68.75% | 1,032 | 27.92% | 123 | 3.33% | 1,509 | 40.83% | 3,696 |
| Custer | 1,744 | 74.06% | 530 | 22.51% | 81 | 3.43% | 1,214 | 51.55% | 2,355 |
| Elmore | 5,227 | 65.31% | 2,513 | 31.40% | 263 | 3.29% | 2,714 | 33.91% | 8,003 |
| Franklin | 5,195 | 92.77% | 325 | 5.80% | 80 | 1.43% | 4,870 | 86.97% | 5,600 |
| Fremont | 4,907 | 84.57% | 810 | 13.96% | 85 | 1.47% | 4,097 | 70.61% | 5,802 |
| Gem | 5,311 | 70.90% | 1,957 | 26.12% | 223 | 2.98% | 3,354 | 44.78% | 7,491 |
| Gooding | 3,696 | 72.22% | 1,287 | 25.15% | 135 | 2.63% | 2,409 | 47.07% | 5,118 |
| Idaho | 5,921 | 75.52% | 1,708 | 21.79% | 211 | 2.69% | 4,213 | 53.73% | 7,840 |
| Jefferson | 9,895 | 86.94% | 1,303 | 11.45% | 183 | 1.61% | 8,592 | 75.49% | 11,381 |
| Jerome | 4,804 | 71.52% | 1,699 | 25.29% | 214 | 3.19% | 3,105 | 46.23% | 6,717 |
| Kootenai | 39,381 | 65.09% | 18,851 | 31.16% | 2,273 | 3.75% | 20,530 | 33.93% | 60,505 |
| Latah | 7,589 | 44.32% | 8,306 | 48.51% | 1,229 | 7.17% | -717 | -4.19% | 17,124 |
| Lemhi | 3,029 | 73.70% | 960 | 23.36% | 121 | 2.94% | 2,069 | 50.34% | 4,110 |
| Lewis | 1,173 | 72.63% | 396 | 24.52% | 46 | 2.85% | 777 | 48.11% | 1,615 |
| Lincoln | 1,141 | 68.61% | 469 | 28.20% | 53 | 3.19% | 672 | 40.41% | 1,663 |
| Madison | 13,445 | 93.29% | 832 | 5.77% | 135 | 0.94% | 12,613 | 87.52% | 14,412 |
| Minidoka | 5,442 | 78.04% | 1,390 | 19.93% | 141 | 2.03% | 4,052 | 58.11% | 6,973 |
| Nez Perce | 9,967 | 58.65% | 6,451 | 37.96% | 575 | 3.39% | 3,516 | 20.69% | 16,993 |
| Oneida | 1,838 | 87.98% | 217 | 10.39% | 34 | 1.63% | 1,621 | 77.59% | 2,089 |
| Owyhee | 2,794 | 75.03% | 833 | 22.37% | 97 | 2.60% | 1,961 | 52.66% | 3,724 |
| Payette | 6,004 | 70.68% | 2,271 | 26.73% | 220 | 2.59% | 3,733 | 43.95% | 8,495 |
| Power | 1,870 | 64.39% | 982 | 33.82% | 52 | 1.79% | 888 | 30.57% | 2,904 |
| Shoshone | 2,699 | 52.43% | 2,277 | 44.23% | 172 | 3.34% | 422 | 8.20% | 5,148 |
| Teton | 2,458 | 54.34% | 1,926 | 42.58% | 139 | 3.08% | 532 | 11.76% | 4,523 |
| Twin Falls | 19,773 | 69.70% | 7,541 | 26.58% | 1,055 | 3.72% | 12,232 | 43.12% | 28,369 |
| Valley | 2,664 | 54.16% | 2,095 | 42.59% | 160 | 3.25% | 569 | 11.57% | 4,919 |
| Washington | 3,128 | 72.22% | 1,104 | 25.49% | 99 | 2.29% | 2,024 | 46.73% | 4,331 |
| Totals | 420,911 | 64.09% | 212,787 | 32.40% | 23,044 | 3.51% | 208,124 | 31.69% | 656,742 |

|
Democratic
Hold |
Republican
Hold
Gain from Democratic
|
Counties that flipped from Democratic to Republican
Results by congressional district
Romney won both congressional districts.[18]
| District | Obama | Romney | Representative |
|---|---|---|---|
| 1st | 32.19% | 64.91% | Raúl Labrador |
| 2nd | 33.07% | 64.14% | Mike Simpson |
See also
References
- ↑ "Dave Leip's Atlas of U.S. Presidential Elections - Idaho". Retrieved January 4, 2013.
- ↑ "2012 Presidential Election Statistics". Dave Leip’s Atlas of U.S. Presidential Elections. Retrieved March 5, 2018.
- ↑ "Idaho Democratic Delegation 2012". www.thegreenpapers.com. Retrieved July 14, 2016.
- ↑ "District of Columbia Democratic Delegation 2012". www.thegreenpapers.com. Retrieved July 14, 2016.
- ↑ "Idaho Republican Delegation 2012".
- ↑ "Election and voting information" (PDF).
- ↑ "Idaho Republican Presidential Nominating Process". The Green Papers. Retrieved March 5, 2012.
- ↑ "Declared 2012 Republican Presidential Candidates". May 27, 2018.
- 1 2 Nate Silver (March 4, 2012). "Romney Could Win Majority of Super Tuesday Delegates". FiveThirtyEight. Retrieved March 5, 2012.
- 1 2 "Presidential Race Graph". Archived from the original on March 6, 2012. Retrieved February 28, 2012.
- 1 2 http://www.kivitv.com/news/local/136861888.html
- 1 2 "Presidential Race Graph". Archived from the original on March 6, 2012. Retrieved March 4, 2012.
- 1 2 "Presidential Race Graph". Archived from the original on March 6, 2012. Retrieved March 2, 2012.
- ↑ Bodnar, Marissa. "Idaho GOP Gears Up For 2012 Straw Poll, Caucus". Local News 8. NPG of Idaho, Inc. Retrieved July 14, 2016.
- ↑ "Caucus Results | Idaho GOPIdaho GOP". Archived from the original on July 20, 2012. Retrieved July 19, 2012.
- ↑ "Idaho County Map". CNN.
- ↑ "2012 Presidential General Election Results - Idaho". Dave Leip's Atlas of U.S. Presidential Elections.
- ↑ "Daily Kos Elections' statewide election results by congressional and legislative districts". Daily Kos. Retrieved August 11, 2020.
External links
- The Green Papers: for Idaho
- The Green Papers: Major state elections in chronological order