Jharbaria | |
|---|---|
| Nickname: Village Jharbaria | |
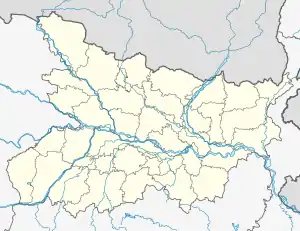
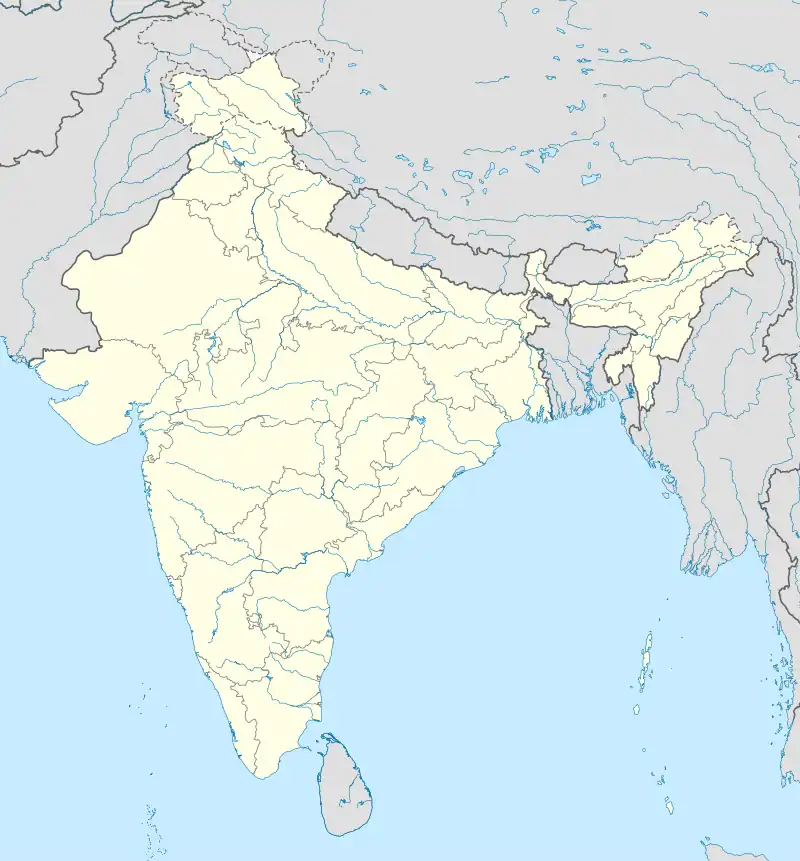
 Jharbaria Location of Jharbaria in Bihar  Jharbaria Jharbaria (India) | |
| Coordinates: 25°58′13″N 86°06′29″E / 25.970286°N 86.107963°E | |
| Country | |
| State | Bihar |
| District | Darbhanga district |
| Area | |
| • Total | 1.1 sq mi (3 km2) |
| Population | 2,000 |
| Languages | |
| • Official | Hindi/Maithili |
| • Spoken | Maithili |
| Time zone | UTC+5:30 (IST) |
| PIN | 847105 |
| Area code | 06272 |
Jharbaria is a village in the Indian state of Bihar located near Baheri town in Darbhanga District. It is 36 kilometres (22 mi) southeast of Darbhanga. As of 2011, Jharbaria had a population of 2000. People of the village are mostly dependent on agricultural income along with government jobs.
Neighbouring Village
Bandhuli (1 km), Inay (3 km), Havidih (5 km), Madhuban ( 7 km ), Rajwara ( 5 km ), Pawra ( 4 km ), Baheri ( 8.5 km ) are the nearby Villages to Jharbaria. Jharbaria is surrounded by Baheri Block towards west, Biraul Block towards East, Benipur towards North.
Transport
Jharbaria is well connected with nearest town Baheri and Darbhanga via road services. Nearest railway The Darbhanga Junction connects very large part of North Bihar and Tarai of Nepal with rest of India as major Rail head. It is the main station of Darbhanga & Madhubani. One more railway station of the city is known as Laheriasarai Railway Station. Laheriasarai is famous for the Lah(Lahthi).
Education
Education level in Jharbaria village is rapidly increasing. Village has government primary school beside private schools for elementary/primary education. Nearby college and High school in Baheri provides opportunity for higher education.
Climate
Jharbaria, Baheri (Darbhanga) has a humid subtropical climate (Köppen climate classification Cwa).
| Climate data for Jharbaria (Darbhanga) | |||||||||||||
|---|---|---|---|---|---|---|---|---|---|---|---|---|---|
| Month | Jan | Feb | Mar | Apr | May | Jun | Jul | Aug | Sep | Oct | Nov | Dec | Year |
| Record high °C (°F) | 30.4 (86.7) |
33.9 (93.0) |
39.9 (103.8) |
42.0 (107.6) |
41.9 (107.4) |
43.4 (110.1) |
39.1 (102.4) |
38.4 (101.1) |
39.6 (103.3) |
39.2 (102.6) |
33.9 (93.0) |
29.9 (85.8) |
43.4 (110.1) |
| Mean daily maximum °C (°F) | 22.1 (71.8) |
25.8 (78.4) |
31.0 (87.8) |
34.1 (93.4) |
35.0 (95.0) |
34.9 (94.8) |
32.5 (90.5) |
32.8 (91.0) |
32.5 (90.5) |
31.6 (88.9) |
28.0 (82.4) |
24.8 (76.6) |
30.68 (87.22) |
| Mean daily minimum °C (°F) | 9.2 (48.6) |
11.0 (51.8) |
15.1 (59.2) |
19.1 (66.4) |
21.2 (70.2) |
22.9 (73.2) |
23.8 (74.8) |
24.2 (75.6) |
23.8 (74.8) |
21.2 (70.2) |
15.8 (60.4) |
10.6 (51.1) |
18.18 (64.72) |
| Record low °C (°F) | −0.2 (31.6) |
−0.2 (31.6) |
3.9 (39.0) |
9.2 (48.6) |
10.4 (50.7) |
15.9 (60.6) |
18.7 (65.7) |
19.4 (66.9) |
18.9 (66.0) |
12.7 (54.9) |
7.2 (45.0) |
2.4 (36.3) |
−0.2 (31.6) |
| Average precipitation mm (inches) | 13.0 (0.51) |
14.0 (0.55) |
9.0 (0.35) |
29.0 (1.14) |
76.0 (2.99) |
139.0 (5.47) |
353.0 (13.90) |
254.0 (10.00) |
193.0 (7.60) |
73.0 (2.87) |
6.0 (0.24) |
7.0 (0.28) |
1,166 (45.9) |
| Average rainy days | 1.6 | 1.7 | 1.6 | 2.6 | 4.6 | 7.6 | 16.4 | 12.2 | 10.5 | 3.4 | 0.5 | 1.0 | 63.7 |
| Average relative humidity (%) | 68 | 63 | 49 | 56 | 60 | 70 | 78 | 79 | 79 | 73 | 66 | 67 | 67 |
| Source: NOAA (1971–1990)[1] | |||||||||||||
Media
.jpg.webp)


References
- ↑ "Zahedan Climate Normals 1971–1990". National Oceanic and Atmospheric Administration. Retrieved 22 December 2012.