Kirklees Council is the local authority for the metropolitan borough of Kirklees in West Yorkshire, England. Since the last boundary changes in 2004, the council has comprised 69 councillors representing 23 wards. Elections are held three years out of four, with one third of the councillors (one for each ward) elected each time for a four-year term.[1]
Council elections
| Election | Labour | Conservative | Liberal Democrat/Liberal | UKIP | Green | Independent | Other | Control |
|---|---|---|---|---|---|---|---|---|
| 1973[2] | 45 | 14 | 8 | 0 | 0 | 1 | 0 | Labour |
| 1975[3] | 36 | 28 | 7 | 0 | 0 | 1 | 0 | Labour hold |
| 1976[4] | 25 | 50 | 9 | 0 | 0 | 0 | 0 | Conservative gain from Labour |
| 1978[5] | 15 | 48 | 9 | 0 | 0 | 0 | 0 | Conservative hold |
| 1979[6] | 32 | 35 | 5 | 0 | 0 | 0 | 0 | Conservative lose to no overall control |
| 1980[7] | 44 | 25 | 3 | 0 | 0 | 0 | 0 | Labour gain from no overall control |
| 1982[8][9] | 37 | 19 | 12 | 0 | 0 | 0 | 4 | Labour hold |
| 1983[10] | 37 | 20 | 12 | 0 | 0 | 0 | 3 | Labour hold |
| 1984[11] | 37 | 18 | 14 | 0 | 0 | 0 | 3 | Labour hold |
| 1986[12] | 36 | 18 | 17 | 0 | 0 | 1 | 0 | Labour hold |
| 1987[13] | 33 | 21 | 18 | 0 | 0 | 0 | 0 | Labour lose to no overall control |
| 1988[14] | 33 | 23 | 15 | 0 | 0 | 1 | 0 | No overall control |
| 1990[15] | 45 | 15 | 12 | 0 | 0 | 0 | 0 | Labour gain from no overall control |
| 1992[16] | 41 | 19 | 10 | 0 | 0 | 2 | 0 | Labour hold |
| 1994[17] | 35 | 21 | 15 | 0 | 0 | 1 | 0 | Labour lose to no overall control |
| 1995[18] | 40 | 16 | 14 | 0 | 0 | 2 | 0 | Labour gain from no overall control |
| 1996[19] | 45 | 6 | 18 | 0 | 1 | 1 | 1 vacancy | Labour hold |
| 1998[20] | 43 | 7 | 20 | 0 | 2 | 0 | 0 | Labour hold |
| 1999[21] | 36 | 10 | 23 | 0 | 3 | 0 | 0 | Labour lose to no overall control |
| 2000[22] | 25 | 15 | 29 | 0 | 3 | 0 | 0 | No overall control |
| 2002[23] | 26 | 15 | 28 | 0 | 3 | 0 | 0 | No overall control |
| 2003[24] | 22 | 16 | 31 | 0 | 3 | 0 | 0 | No overall control |
| 2004[25] | 17 | 22 | 25 | 0 | 3 | 1 | 1 | No overall control |
| 2006[26] | 20 | 21 | 20 | 0 | 3 | 1 | 4 | No overall control |
| 2007[27] | 22 | 20 | 18 | 0 | 4 | 1 | 4 | No overall control |
| 2008[28] | 22 | 21 | 19 | 0 | 4 | 0 | 3 | No overall control |
| 2010[29] | 24 | 19 | 20 | 0 | 4 | 2 | 0 | No overall control |
| 2011[30] | 27 | 21 | 14 | 0 | 4 | 3 | 0 | No overall control |
| 2012[31] | 32 | 18 | 10 | 0 | 5 | 4 | 0 | No overall control |
| 2014[32] | 32 | 18 | 10 | 0 | 5 | 4 | 0 | No overall control |
| 2015[33] | 34 | 18 | 10 | 0 | 4 | 3 | 0 | No overall control |
| 2016[34] | 34 | 20 | 9 | 0 | 3 | 3 | 0 | No overall control |
| 2018[35] | 36 | 20 | 7 | 0 | 3 | 3 | 0 | Labour gain from no overall control |
| 2019[36] | 35 | 17 | 10 | 0 | 3 | 4 | 0 | Labour hold |
- 1998 Kirklees Metropolitan Borough Council election
- 1999 Kirklees Metropolitan Borough Council election
- 2000 Kirklees Metropolitan Borough Council election
- 2002 Kirklees Metropolitan Borough Council election
- 2003 Kirklees Metropolitan Borough Council election
- 2004 Kirklees Metropolitan Borough Council election
- 2006 Kirklees Metropolitan Borough Council election
- 2007 Kirklees Metropolitan Borough Council election
- 2008 Kirklees Metropolitan Borough Council election
- 2010 Kirklees Metropolitan Borough Council election
- 2011 Kirklees Metropolitan Borough Council election
- 2012 Kirklees Metropolitan Borough Council election
- 2014 Kirklees Metropolitan Borough Council election
- 2015 Kirklees Metropolitan Borough Council election
- 2016 Kirklees Metropolitan Borough Council election
- 2018 Kirklees Metropolitan Borough Council election
- 2019 Kirklees Metropolitan Borough Council election
- 2021 Kirklees Metropolitan Borough Council election
- 2022 Kirklees Metropolitan Borough Council election
- 2023 Kirklees Metropolitan Borough Council election
District result maps
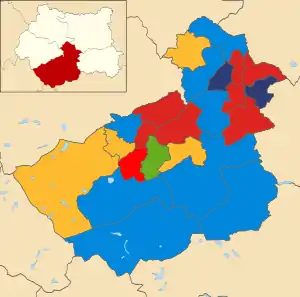 2006 results map
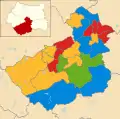 2007 results map
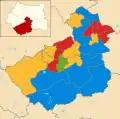 2008 results map
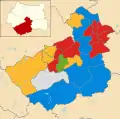 2010 results map
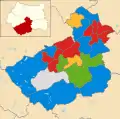 2011 results map
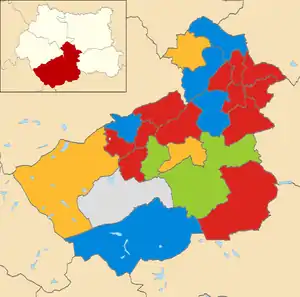 2012 results map
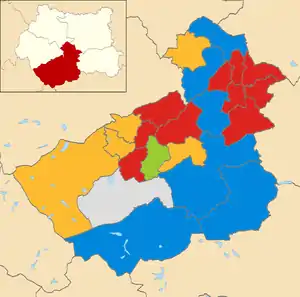 2014 results map
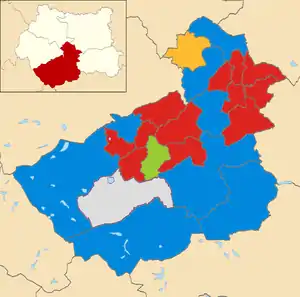 2015 results map
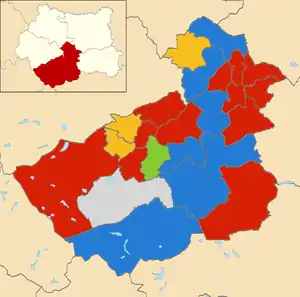 2016 results map
By-election results
| Party | Candidate | Votes | % | ±% | |
|---|---|---|---|---|---|
| Labour | 1,558 | 48.9 | |||
| Liberal Democrats | 1,179 | 37.0 | |||
| Conservative | 375 | 11.7 | |||
| Green | 73 | 2.3 | |||
| Majority | 377 | 11.9 | |||
| Turnout | 3,185 | ||||
| Labour hold | Swing | ||||
| Party | Candidate | Votes | % | ±% | |
|---|---|---|---|---|---|
| Liberal Democrats | 2,077 | 50.6 | |||
| Labour | 1,418 | 34.5 | |||
| Conservative | 486 | 11.8 | |||
| Green | 124 | 3.0 | |||
| Majority | 659 | 16.1 | |||
| Turnout | 4,105 | 38.2 | |||
| Liberal Democrats hold | Swing | ||||
| Party | Candidate | Votes | % | ±% | |
|---|---|---|---|---|---|
| Labour | 1,219 | 55.5 | +1.7 | ||
| Conservative | 710 | 32.3 | -3.5 | ||
| Liberal Democrats | 268 | 12.2 | +6.2 | ||
| Majority | 509 | 23.2 | |||
| Turnout | 2,197 | 16.0 | |||
| Labour gain from Conservative | Swing | ||||
| Party | Candidate | Votes | % | ±% | |
|---|---|---|---|---|---|
| Liberal Democrats | 1,236 | 43.8 | +31.3 | ||
| Labour | 1,039 | 36.8 | -16.6 | ||
| Conservative | 456 | 16.2 | -9.2 | ||
| Socialist Labour | 90 | 3.2 | +0.3 | ||
| Majority | 197 | 7.0 | |||
| Turnout | 2,821 | 25.1 | |||
| Liberal Democrats gain from Labour | Swing | ||||
| Party | Candidate | Votes | % | ±% | |
|---|---|---|---|---|---|
| Liberal Democrats | 1,174 | 43.4 | -13.1 | ||
| Labour | 976 | 36.0 | +13.3 | ||
| Conservative | 518 | 19.1 | +3.4 | ||
| Socialist | 40 | 1.5 | +1.5 | ||
| Majority | 198 | 7.4 | |||
| Turnout | 2,708 | 21.4 | |||
| Liberal Democrats hold | Swing | ||||
| Party | Candidate | Votes | % | ±% | |
|---|---|---|---|---|---|
| Conservative | 3,176 | 41.2 | -14.6 | ||
| Labour | 2,892 | 37.5 | +3.8 | ||
| Liberal Democrats | 1,651 | 21.4 | +13.6 | ||
| Majority | 284 | 3.7 | |||
| Turnout | 7,719 | ||||
| Liberal Democrats hold | Swing | ||||
| Party | Candidate | Votes | % | ±% | |
|---|---|---|---|---|---|
| BNP | David Exley | 1,607 | 27.7 | +27.7 | |
| Liberal Democrats | Tabasum Aslam | 1,493 | 25.8 | +3.9 | |
| Independent | Tim Crowther | 1,147 | 19.8 | +19.8 | |
| Labour | Florence Smith | 982 | 16.9 | -22.9 | |
| Conservative | Roger Roberts | 490 | 8.5 | -22.9 | |
| Green | Heidi Smithson | 76 | 1.3 | -5.6 | |
| Majority | 114 | 1.9 | |||
| Turnout | 5,795 | 43.8 | |||
| BNP gain from Labour | Swing | ||||
| Party | Candidate | Votes | % | ±% | |
|---|---|---|---|---|---|
| Labour | Barbara Jones | 2,904 | 63.5 | +6.5 | |
| Liberal Democrats | John O'Reilly | 814 | 17.8 | -0.7 | |
| Conservative | Paul Murphy | 287 | 6.3 | -4.1 | |
| Green | Paul Cooney | 240 | 5.3 | -2.1 | |
| Respect | David Ellis | 178 | 3.9 | +3.9 | |
| BNP | Barry Fowler | 148 | 3.2 | -3.5 | |
| Majority | 2,090 | 45.7 | |||
| Turnout | 4,571 | 35.1 | |||
| Labour hold | Swing | ||||
| Party | Candidate | Votes | % | ±% | |
|---|---|---|---|---|---|
| Labour | Peter Daniel McBride | 1,397 | 40.5 | +10.0 | |
| Liberal Democrats | Alison Louise Munro | 1,155 | 33.5 | -0.8 | |
| Conservative | Martin James Leonard | 605 | 17.5 | -1.9 | |
| BNP | Jonathan David Baxter Wright | 157 | 4.5 | -6.3 | |
| Green | David William Hargreaves | 103 | 3.0 | -2.0 | |
| Independent | Colin Anthony Walder | 34 | 1.0 | +1.0 | |
| Majority | 242 | 7.0 | |||
| Turnout | 3,451 | 27.5 | |||
| Labour hold | Swing | ||||
| Party | Candidate | Votes | % | ±% | |
|---|---|---|---|---|---|
| Labour | Cathy Scott | 1,513 | 37.4 | -2.0 | |
| Liberal Democrats | Dennis Hullock | 1,405 | 34.8 | +14.3 | |
| BNP | Joe Barber | 690 | 17.1 | -10.6 | |
| Conservative | Amelia Lynne Bolton | 345 | 8.5 | -3.9 | |
| Green | Adrian Hugh Cruden | 58 | 1.4 | N/A | |
| Independent | Safiq Ali Patel | 17 | 0.4 | N/A | |
| Independent | Alan Girvan | 15 | 0.4 | N/A | |
| Majority | 108 | 2.7 | |||
| Turnout | 4,043 | 31.0 | |||
| Labour gain from BNP | Swing | ||||
| Party | Candidate | Votes | % | ±% | |
|---|---|---|---|---|---|
| Labour | Simon Alvy | 1,517 | 43.4 | ||
| Conservative | Sharon Light | 1.378 | 39.4 | ||
| Liberal Democrats | Richard Farnhill | 599 | 17.1 | ||
| Majority | 139 | 4.0 | |||
| Turnout | 3,494 | 25.3 | |||
| Labour gain from Conservative | Swing | ||||
| Party | Candidate | Votes | % | ±% | |
|---|---|---|---|---|---|
| Liberal Democrats | Christine Mary Iredale | 1,591 | 47.6 | ||
| Labour | Stephan Georg Jungnitz | 901 | 27.0 | ||
| UKIP | Gregory Lloyd Broome | 450 | 13.5 | ||
| Green | Daniel Edward Greenwood | 210 | 6.3 | ||
| Conservative | Clinton Noel Simpson | 189 | 5.7 | ||
| Majority | 690 | 20.7 | |||
| Turnout | 3,341 | 23.0 | |||
| Liberal Democrats gain from Labour | Swing | ||||
| Party | Candidate | Votes | % | ±% | |
|---|---|---|---|---|---|
| Labour | Habiban Nisa Zaman | 2,640 | 76.8 | ||
| Conservative | Paul Young | 443 | 12.9 | ||
| Independent | Aleks Lukic | 140 | 4.1 | ||
| Liberal Democrats | Jon Robert Bloom | 136 | 4.0 | ||
| Green | David Michael Smith | 70 | 2.0 | ||
| Majority | 2,197 | 63.9 | |||
| Turnout | 3,437 | 25.9 | |||
| Labour hold | Swing | ||||
| Party | Candidate | Votes | % | ±% | |
|---|---|---|---|---|---|
| Labour | Will Simpson | 1,834 | 46.7 | ||
| Conservative | Paula Kemp | 1,689 | 43.0 | ||
| Liberal Democrats | Alison Baskeyfield | 289 | 7.4 | ||
| Green | Isabel Walters | 116 | 3.0 | ||
| Majority | 145 | 3.7 | |||
| Turnout | 3,928 | ||||
| Labour gain from Conservative | Swing | ||||
| Party | Candidate | Votes | % | ±% | |
|---|---|---|---|---|---|
| Conservative | Donna Bellamy | 4,504 | 45.8 | ||
| Labour | Duggs Carre | 3,308 | 46.7 | ||
| Liberal Democrats | Robert Iredale | 1,386 | 14.1 | ||
| Green | Ian Vincent | 646 | 6.6 | ||
| Majority | 1,196 | 12.1 | |||
| Turnout | 9,844 | ||||
| Conservative gain from Labour | Swing | ||||
| Party | Candidate | Votes | % | ±% | |
|---|---|---|---|---|---|
| Labour | Eric Firth | 3,299 | 42.0 | ||
| Conservative | Keith Mallinson | 2,669 | 33.9 | ||
| Heavy Woollen Independents | Ian Vincent | 1,515 | 19.3 | ||
| Liberal Democrats | Dennis Hullock | 380 | 4.8 | ||
| Majority | 630 | 8.0 | |||
| Turnout | 7,863 | ||||
| Labour hold | Swing | ||||
Notes
References
- ↑ "The Borough of Kirklees (Electoral Changes) Order 2003", legislation.gov.uk, The National Archives, SI 2003/3091, retrieved 18 June 2023
- ↑ "Three major parties find cause for satisfaction in local election results despite low poll". The Times. 14 May 1973.
- ↑ "Tories capture 199 seats in 'big cities' poll triumph, May Day blow to Labour as the Tories make many gains in district council elections". The Times. 2 May 1975.
- ↑ "Tories seize cities but fail to achieve expected landslide". The Times. 7 May 1976.
- ↑ "Power shift in only eight of 80 councils outside London". The Times. 6 May 1978. p. 3.
- ↑ Whitaker's Almanac, 1980
- ↑ "Labour makes gains throughout Britain in local government elections". The Times. 2 May 1980. p. 4.
- ↑ "How the councils fared". The Times. 8 May 1982. p. 2.
- ↑ "Conservative candidates hold ground as Alliance bandwagon falters". The Times. 7 May 1982. p. 2.
- ↑ "How votes were cast in local government elections". The Times. 7 May 1983. p. 4.
- ↑ "Labour captures Birmingham, Tories hold Birmingham". The Times. 6 May 1983. p. 4.
- ↑ "How the main parties fared in Britain's local elections". The Times. 10 May 1986.
- ↑ "Results in Thiursday's local elections". The Times. 9 May 1987.
- ↑ "The gains and losses: Council election results in full". The Times. 7 May 1988.
- ↑ "Local election results". The Times. 5 May 1990.
- ↑ "Local election results 1992". The Times. 9 May 1992. p. 6.
- ↑ "Local elections: Tories lose 18 councils in worst poll performance". The Guardian. 7 May 1994. p. 4.
- ↑ "Complete list of results from Thursday's local elections". The Times. 6 May 1995. p. 10.
- ↑ "Complete list of results". The Times. 4 May 1996. p. 8.
- ↑ "Local election results". The Times. 9 May 1998. p. 46.
- ↑ "How Britain voted: Council election results". The Independent. 8 May 1999. p. 12.
- ↑ "Election results: Local councils". The Times. 6 May 2000. p. 10.
- ↑ "Election results: Local councils". The Times. 4 May 2002. p. 16.
- ↑ "Election results". Financial Times. 3 May 2003. p. 8.
- ↑ "Local elections 2004 - Election summary". Voting and elections. Kirklees Council. April 2007. Archived from the original on 5 December 2008. Retrieved 15 February 2009.
- ↑ "Local elections 2006 - Election summary". Voting and elections. Kirklees Council. April 2007. Retrieved 9 May 2016.
- ↑ "Local elections 2007 - Election summary". Voting and elections. Kirklees Council. April 2007. Archived from the original on 12 February 2012. Retrieved 8 May 2016.
- ↑ "Results for the 01 May 2008 District Council Election". Kirklees Council. May 2008. Retrieved 15 February 2009.
- ↑ "Local elections 2010 - Election summary". Voting and elections. Kirklees Council. April 2007. Retrieved 8 May 2016.
- ↑ "Local elections 2010 - Election summary". Voting and elections. Kirklees Council. April 2007. Retrieved 8 May 2016.
- ↑ "Local elections 2012 - Election summary". Voting and elections. Kirklees Council. April 2007. Retrieved 8 May 2016.
- ↑ "Local elections 2014 - Election summary". Voting and elections. Kirklees Council. April 2007. Retrieved 8 May 2016.
- ↑ "Local elections 2015 - Election summary". Voting and elections. Kirklees Council. April 2007. Retrieved 8 May 2016.
- ↑ "Local elections 2016 - Election summary". Voting and elections. Kirklees Council. April 2007. Retrieved 8 May 2016.
- ↑ "Local elections 2018 - Election summary". Voting and elections. Kirklees Council. April 2007. Retrieved 7 May 2018.
- ↑ "Local elections 2019 - Election summary". Voting and elections. Kirklees Council. May 2019. Retrieved 2 May 2019.
- ↑ "District council, Heckmondwike by-election result, 14 August 2003". Kirklees Council. Retrieved 6 August 2016.
- ↑ "District council, Greenhead by-election result, 27 July 2006". Kirklees Council. Retrieved 6 August 2016.
- ↑ "District council, Dalton by-election result, 10 July 2008". Kirklees Council. Retrieved 6 August 2016.
- ↑ "District council, Dewsbury East by-election result, 16 October 2008". Kirklees Council. Retrieved 1 August 2016.
- ↑ "Liversedge and Gomersal, 2013". EnglishElections. Archived from the original on 4 August 2016. Retrieved 15 August 2017.
- ↑ "District council, Golcar by-election result, 21 November 2013". Kirklees Council. Retrieved 1 August 2016.
- ↑ "District council, Batley East by-election result, 26 October 2017" (PDF). Kirklees Council. Retrieved 27 December 2017.
- ↑ "Local Elections Archive Project — Denby Dale Ward". www.andrewteale.me.uk. Retrieved 19 April 2022.
- ↑ "Local Elections Archive Project — Colne Valley Ward". www.andrewteale.me.uk. Retrieved 19 April 2022.
- ↑ "Local Elections Archive Project — Dewsbury West Ward". www.andrewteale.me.uk. Retrieved 19 April 2022.
External links
This article is issued from Wikipedia. The text is licensed under Creative Commons - Attribution - Sharealike. Additional terms may apply for the media files.
