Lancashire County Council elections are held every four years. Lancashire County Council is the upper-tier authority for the non-metropolitan county of Lancashire in England. Since the last boundary changes in 2017, 84 councillors have been elected from 82 electoral divisions.[1]
Election results
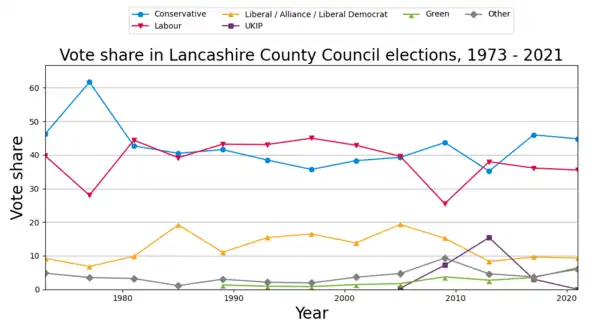
Lancashire County Council elections, vote share per party by year. Post-merger Liberal Party counted as an 'other' party.
Council composition
The composition of the council immediately following election, and excluding any subsequent by-election changes, has been:
| Overall control | Cons. | Labour | Lib Dems [n 1] | Green | UKIP | BNP | Idle Toad | Independents/Other | |||||||||
| 2021[2] | Conservative | 48 | 32 | 2 | 2 | 0 | - | - | 0 | ||||||||
| 2017[3] | Conservative | 46 | 30 | 4 | 1 | 1 | 0 | - | 2 [n 2] | ||||||||
| 2013[4] | NOC | 35 | 38 | 6 | 1 | 0 | 0 | 0 | 3 [n 3] | ||||||||
| 2009[5] | Conservative | 51 | 16 | 10 | 2 | 0 | 1 | 1 | 3 [n 4] | ||||||||
| 2005[6] | Labour | 31 | 44 | 6 | 1 | 0 | 0 | 1 | 1 [n 5] | ||||||||
| 2001[7][8] | Labour | 26 | 44 | 6 | 1 | - | - | - | 1 [n 6] | ||||||||
| 1997[9] | Labour | 23 | 47 | 7 | 0 | - | - | - | 1 [n 7] | ||||||||
| 1993 | Labour | 35 | 54 | 10 | 0 | - | - | - | 0 | ||||||||
| 1989 | Labour | 42 | 50 | 4 | 0 | - | - | - | 3 [n 8] | ||||||||
| 1985 | Labour | 42 | 48 | 9 | - | - | - | - | 0 | ||||||||
| 1981 | Labour | 38 | 53 | 6 | - | - | - | - | 2 [n 9] | ||||||||
| 1977 | Conservative | 83 | 12 | 1 | - | - | - | - | 0 | ||||||||
| 1973 | Conservative | 52 | 33 | 7 | - | - | - | - | 4 [n 10] | ||||||||
Council elections
- 1973 Lancashire County Council election
- 1977 Lancashire County Council election
- 1981 Lancashire County Council election (new division boundaries)[10]
- 1985 Lancashire County Council election
- 1989 Lancashire County Council election
- 1993 Lancashire County Council election
- 1997 Lancashire County Council election
- 2001 Lancashire County Council election
- 2005 Lancashire County Council election (new division boundaries)[11]
- 2009 Lancashire County Council election
- 2013 Lancashire County Council election
- 2017 Lancashire County Council election (new division boundaries)[1]
- 2021 Lancashire County Council election
County result maps
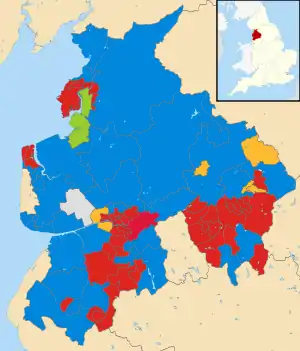 2005 results map
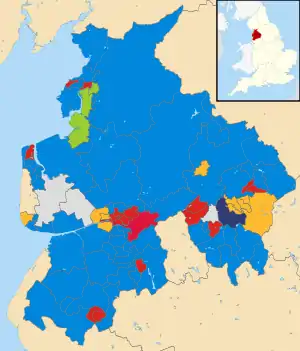 2009 results map
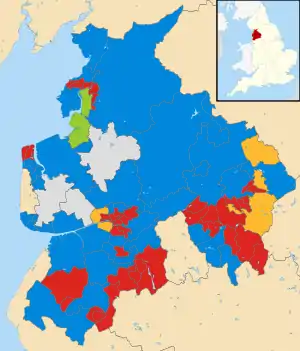 2013 results map
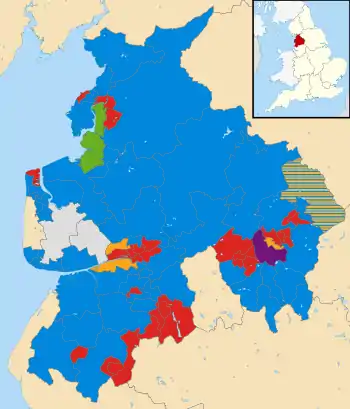 2017 results map
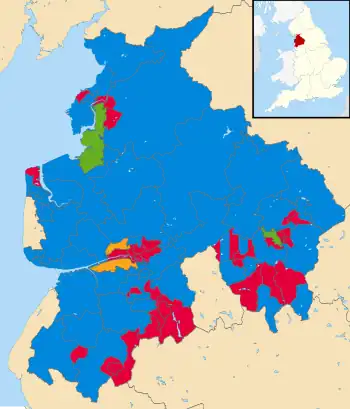 2021 results map
By-election results
Elections in the 1990s
| Party | Candidate | Votes | % | ±% | |
|---|---|---|---|---|---|
| Labour | 2,263 | 53.1 | |||
| Conservative | 2,004 | 46.9 | |||
| Majority | 259 | 6.2 | |||
| Turnout | 4,267 | 37.9 | |||
| Labour hold | Swing | ||||
| Party | Candidate | Votes | % | ±% | |
|---|---|---|---|---|---|
| Labour | 1,644 | 60.4 | -5.3 | ||
| Conservative | 1,076 | 39.6 | +5.3 | ||
| Majority | 568 | 20.8 | |||
| Turnout | 2,720 | 31.1 | |||
| Labour hold | Swing | ||||
| Party | Candidate | Votes | % | ±% | |
|---|---|---|---|---|---|
| Labour | 751 | 38.5 | -11.2 | ||
| Conservative | 636 | 32.6 | -2.2 | ||
| Liberal Democrats | 565 | 28.9 | +13.4 | ||
| Majority | 115 | 5.9 | |||
| Turnout | 1,952 | 17.9 | |||
| Labour hold | Swing | ||||
| Party | Candidate | Votes | % | ±% | |
|---|---|---|---|---|---|
| Labour | 1,358 | 48.6 | -5.8 | ||
| Liberal Democrats | 1,296 | 46.3 | +14.7 | ||
| Conservative | 143 | 5.1 | -8.8 | ||
| Majority | 62 | 2.3 | |||
| Turnout | 2,797 | 29.0 | |||
| Labour hold | Swing | ||||
Elections in the 2000s
| Party | Candidate | Votes | % | ±% | |
|---|---|---|---|---|---|
| Liberal Democrats | 1,721 | 48.5 | -4.8 | ||
| Labour | 1,198 | 33.8 | +3.2 | ||
| Conservative | 627 | 17.7 | +2.1 | ||
| Majority | 523 | 14.7 | |||
| Turnout | 3,546 | 32.0 | |||
| Liberal Democrats hold | Swing | ||||
| Party | Candidate | Votes | % | ±% | |
|---|---|---|---|---|---|
| Conservative | 2,242 | 70.6 | +9.2 | ||
| Labour | 933 | 29.4 | -6.8 | ||
| Majority | 1,309 | 41.2 | |||
| Turnout | 3,175 | 30.4 | |||
| Conservative hold | Swing | ||||
| Party | Candidate | Votes | % | ±% | |
|---|---|---|---|---|---|
| Liberal Democrats | Anthony Pimblett | 1,518 | 48.8 | +13.7 | |
| Conservative | P Wakeling | 1,232 | 39.6 | +4.7 | |
| Labour | D Lyon | 358 | 11.5 | -18.4 | |
| Majority | 286 | 9.2 | |||
| Turnout | 3,108 | ||||
| Liberal Democrats hold | Swing | ||||
| Party | Candidate | Votes | % | ±% | |
|---|---|---|---|---|---|
| Conservative | William Parkinson | 1,781 | 49.8 | +20.1 | |
| Liberal Democrats | Howard Henshaw | 1,205 | 33.7 | -14.8 | |
| Labour | Jean Al-Serraj | 590 | 16.5 | -5.2 | |
| Majority | 576 | 16.1 | |||
| Turnout | 3,576 | 28.2 | |||
| Conservative gain from Liberal Democrats | Swing | ||||
| Party | Candidate | Votes | % | ±% | |
|---|---|---|---|---|---|
| Conservative | Jim Lawrenson | 1,536 | 48.3 | +7.7 | |
| Labour | Wayne Martin | 934 | 29.4 | -6.1 | |
| UKIP | Olive Bergin | 489 | 15.4 | +9.5 | |
| Liberal Democrats | Philip Pitman | 220 | 6.9 | -11.1 | |
| Majority | 602 | 18.9 | |||
| Turnout | 3,175=9 | ||||
| Conservative hold | Swing | ||||
Elections in the 2010s
| Party | Candidate | Votes | % | ±% | |
|---|---|---|---|---|---|
| Labour | Misfar Hassan | 3,157 | 44.35 | +4.75 | |
| Liberal Democrats | Martin Smith | 2,279 | 32.01 | -5.95 | |
| BNP | Paul McDevitt | 868 | 12.19 | +2.14 | |
| Conservative | Matthew Isherwood | 815 | 11.45 | -0.94 | |
| Majority | 878 | 12.3 | |||
| Turnout | |||||
| Labour gain from Liberal Democrats | Swing | ||||
| Party | Candidate | Votes | % | ±% | |
|---|---|---|---|---|---|
| Conservative | Vivien Taylor | 2,178 | 58.00 | -7.86 | |
| Labour | Kevin Higginson | 877 | 23.36 | +10.30 | |
| UKIP | Simon Noble | 361 | 9.61 | N/A | |
| Green | Susan White | 339 | 9.03 | -12.06 | |
| Majority | 1,301 | ||||
| Turnout | 3,762 | ||||
| Conservative hold | Swing | ||||
| Party | Candidate | Votes | % | ±% | |
|---|---|---|---|---|---|
| Labour | Lizzi Collinge | 1,758 | 50.85 | +5.95 | |
| Green | Tim Hamilton-Cox | 1,408 | 40.73 | -0.27 | |
| Liberal Democrats | Robin Long | 231 | 6.68 | N/A | |
| TUSC | Steve Metcalfe | 60 | 1.74 | N/A | |
| Majority | 350 | 10.1 | |||
| Turnout | |||||
| Labour hold | Swing | ||||
| Party | Candidate | Votes | % | ±% | |
|---|---|---|---|---|---|
| Conservative | Alan Cullens | 1,144 | 43.76 | +2.65 | |
| Labour | Yvonne Hargreaves | 1,042 | 38.37 | +0.57 | |
| UKIP | Christopher Stuart | 303 | 11.16 | -6.15 | |
| Liberal Democrats | Stephen Fenn | 125 | 4.60 | +0.83 | |
| Majority | 102 | 3.9 | |||
| Turnout | |||||
| Conservative hold | Swing | ||||
| Party | Candidate | Votes | % | ±% | |
|---|---|---|---|---|---|
| Labour | Sobia Malik | 1,348 | 68.88 | +10.74 | |
| Liberal Democrats | Emma Payne | 276 | 14.10 | -1.42 | |
| UKIP | Mark Girven | 249 | 12.72 | -6.68 | |
| Green | Laura Fisk | 84 | 4.29 | N/A | |
| Majority | 1,072 | ||||
| Turnout | |||||
| Labour hold | Swing | ||||
| Party | Candidate | Votes | % | ±% | |
|---|---|---|---|---|---|
| Conservative | Matthew Salter | 1,745 | 60.03 | -6.11 | |
| Labour | Nic Fogg | 925 | 31.82 | +11.01 | |
| Green | Susan White | 237 | 8.15 | -4.90 | |
| Majority | 820 | 59.86 | |||
| Turnout | |||||
| Conservative hold | Swing | ||||
| Party | Candidate | Votes | % | ±% | |
|---|---|---|---|---|---|
| Conservative | Stuart Morris | 1,332 | 48.95 | -14.23 | |
| Liberal Democrats | Andrew Severn | 809 | 29.73 | +21.58 | |
| Labour | Darren Clifford | 580 | 21.32 | -0.71 | |
| Majority | 523 | ||||
| Conservative hold | Swing | ||||
Elections in the 2020s
| Party | Candidate | Votes | % | ±% | |
|---|---|---|---|---|---|
| Labour | Alan Whittaker | 1,642 | 52.1 | +11.1 | |
| Conservative | Val Caunce | 1,279 | 40.6 | -7.9 | |
| Liberal Democrats | Rowan Powers | 231 | 7.3 | +2.0 | |
| Majority | 363 | ||||
| Turnout | |||||
| Labour gain from Conservative | Swing | ||||
| Party | Candidate | Votes | % | ±% | |
|---|---|---|---|---|---|
| Green | Scott Cunliffe | 630 | |||
| Labour | Charles Briggs | 583 | |||
| Conservative | Donald Whitaker | 574 | |||
| Liberal Democrats | Jeff Sumner | 156 | |||
| Majority | 47 | ||||
| Green hold | |||||
The Burnley Central West by-election was triggered by the resignation of Green councillor Andy Fewings.[12]
Notes
References
- 1 2 "The Lancashire (Electoral Changes) Order 2016", legislation.gov.uk, The National Archives, SI 2016/1069, retrieved 22 August 2022
- ↑ "Election Results - How it stands [2021]". Lancashire County Council. Retrieved 26 November 2023.
- ↑ "Election Results - How it stands [2017]". Lancashire County Council. Retrieved 26 November 2023.
- ↑ "Election Results - All Results (2013)". Lancashire County Council. Retrieved 26 November 2023.
- ↑ "Election Results - Declared result for election held on 04 June 2009". Lancashire County Council. Retrieved 26 November 2023.
- ↑ "Election Results - Declared result for election held on 05 May 2005". Lancashire County Council. Retrieved 26 November 2023.
- ↑ "List of Elected Candidates [2001]". Lancashire County Council. Archived from the original on 29 April 2013. Retrieved 26 November 2023.
- ↑ "By Elections and Changes [2001]". Lancashire County Council. Archived from the original on 29 April 2013. Retrieved 26 November 2023.
- ↑ "Lancashire County Council Election Results 1973-2009" (PDF). The Elections Centre. Retrieved 26 November 2023.
- ↑ The County of Lancashire (Electoral Arrangements) Order 1981 S.I. 1981/43
- ↑ "The County of Lancashire (Electoral Changes) Order 2005", legislation.gov.uk, The National Archives, SI 2005/170, retrieved 22 August 2022
- ↑ Longworth, Laura (27 October 2023). "Burnley Green Party successfully defends seats on Burnley Borough Council and Lancashire County Council". Burnley Express. Retrieved 27 October 2023.
External links
This article is issued from Wikipedia. The text is licensed under Creative Commons - Attribution - Sharealike. Additional terms may apply for the media files.