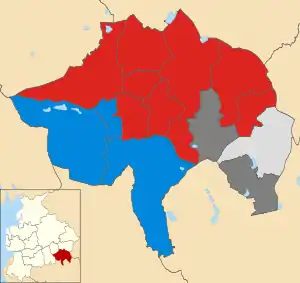
Map of the results of the 2012 Rossendale council election. Labour in red, Conservatives in blue and independent in light grey. Wards in dark grey were not contested in 2012.
Elections to Rossendale Borough Council were held on 3 May 2012.[1][2]
Councillors elected in 2008 were defending their seats this year, with their vote share change compared to that year.
Election result
| Party | Seats | Gains | Losses | Net gain/loss | Seats % | Votes % | Votes | +/− | |
|---|---|---|---|---|---|---|---|---|---|
| Conservative | |||||||||
| Liberal Democrats | |||||||||
| Labour | |||||||||
| National Front | |||||||||
| Independent | |||||||||
Ward results
| Party | Candidate | Votes | % | ±% | |
|---|---|---|---|---|---|
| Labour | Andrea Fletcher | 622 | 62.7 | +27.3 | |
| Conservative | Sandra McWicker | 295 | 29.7 | -5.7 | |
| Liberal Democrats | Graham Fox | 75 | 7.6 | -23.4 | |
| Party | Candidate | Votes | % | ±% | |
|---|---|---|---|---|---|
| Conservative | Darryl Smith | 577 | 66.1 | -13.4 | |
| Labour | Janice Johnson | 296 | 33.9 | +13.4 | |
| Party | Candidate | Votes | % | ±% | |
|---|---|---|---|---|---|
| Independent | Madeline de Souza | 512 | 59.2 | N/A | |
| Conservative | Lynda Barnes | 238 | 27.5 | -1.5 | |
| Liberal Democrats | Lesley Ham | 115 | 13.3 | -12.4 | |
| Party | Candidate | Votes | % | ±% | |
|---|---|---|---|---|---|
| Labour | Dorothy Farrington | 862 | 74.6 | +19.3 | |
| Conservative | Dean Bartlett-Smith | 293 | 25.4 | -19.3 | |
| Party | Candidate | Votes | % | ±% | |
|---|---|---|---|---|---|
| Conservative | Gladys Sandiford | 894 | 61.1 | +0.3 | |
| Labour | Gladys Sandiford | 569 | 38.9 | +21.1 | |
| Party | Candidate | Votes | % | ±% | |
|---|---|---|---|---|---|
| Labour | Barbara Ashworth | 726 | 51.0 | +24.9 | |
| Conservative | Judith Driver | 505 | 35.5 | -7.7 | |
| Liberal Democrats | Bill Jackson | 193 | 13.6 | -0.2 | |
| Party | Candidate | Votes | % | ±% | |
|---|---|---|---|---|---|
| Labour | Caroline Bleakley | 805 | 55.3 | 8.6 | |
| Conservative | Michael Pickup | 560 | 38.4 | -14.9 | |
| Liberal Democrats | Joseph Donnelly | 92 | 6.3 | N/A | |
| Party | Candidate | Votes | % | ±% | |
|---|---|---|---|---|---|
| Conservative | Peter Evans | 674 | 37.7 | -22.4 | |
| Labour | John McManus | 566 | 31.7 | +12.0 | |
| Independent | Vernon Hudson | 548 | 30.6 | N/A | |
| Party | Candidate | Votes | % | ±% | |
|---|---|---|---|---|---|
| Labour | Steve Hughes | 551 | 51.9 | +16.9 | |
| Conservative | Hazel Steen | 340 | 32.0 | -9.1 | |
| National Front | Kevin Bryan | 170 | 16.0 | N/A | |
| Party | Candidate | Votes | % | ±% | |
|---|---|---|---|---|---|
| Labour | Roy Knowles | 757 | 54.1 | +22.1 | |
| Conservative | Mohammed Abdullah | 401 | 28.6 | -16.3 | |
| Liberal Democrats | Clive Laight | 242 | 17.3 | N/A | |
| Party | Candidate | Votes | % | ±% | |
|---|---|---|---|---|---|
| Labour | Karen Creaser | 543 | 42.7 | ||
| Liberal Democrats | Tim Nuttall | 480 | 37.8 | ||
| Conservative | Peter Steen | 248 | 19.5 | ||
| Party | Candidate | Votes | % | ±% | |
|---|---|---|---|---|---|
| Labour | Marilyn Procter | 663 | 53.1 | +4.6 | |
| Labour | Marilyn Procter | 663 | 53.1 | +4.6 | |
| UKIP | Granville Barker | 218 | 17.5 | N/A | |
| Conservative | David Stansfield | 368 | 29.5 | -22.0 | |
References
- ↑ "Local elections 2012". BBC News. Retrieved 30 April 2012.
- ↑ Archived 2 September 2012 at the Wayback Machine Rossendale Borough Council
This article is issued from Wikipedia. The text is licensed under Creative Commons - Attribution - Sharealike. Additional terms may apply for the media files.