Lancaster County | |
|---|---|
.jpg.webp) Lancaster County Courthouse | |
 Seal Logo | |
| Motto(s): "Discover Lancaster County, South Carolina" | |
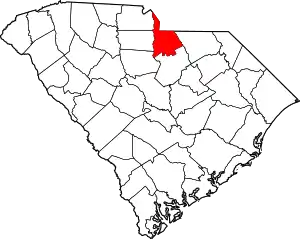
 Location within the U.S. state of South Carolina | |
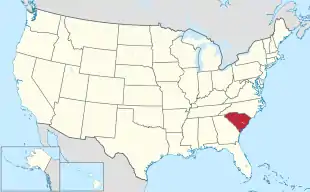
 South Carolina's location within the U.S. | |
| Coordinates: 34°41′13″N 80°42′13″W / 34.686818°N 80.703688°W | |
| Country | |
| State | |
| Founded | 1785 |
| Named for | House of Lancaster |
| Seat | Lancaster |
| Largest community | Lancaster |
| Area | |
| • Total | 555.05 sq mi (1,437.6 km2) |
| • Land | 549.07 sq mi (1,422.1 km2) |
| • Water | 5.98 sq mi (15.5 km2) 1.08% |
| Population (2020) | |
| • Total | 96,016 |
| • Estimate (2022) | 104,577 |
| • Density | 174.87/sq mi (67.52/km2) |
| Time zone | UTC−5 (Eastern) |
| • Summer (DST) | UTC−4 (EDT) |
| Congressional district | 5th |
| Website | mylancastersc |
Lancaster County /ˈlæŋkəstər/[1] is a county located in the U.S. state of South Carolina. As of the 2020 census, its population was 96,016,[2] Its county seat is Lancaster, which has an urban population of 23,979.[3] The county was created in 1785.[4]
Lancaster County is included in the Charlotte-Concord-Gastonia, NC-SC Metropolitan Statistical Area. It is located in the Piedmont region.
History
For hundreds of years, the Catawba Indians occupied what became organized as Lancaster County as part of their historic tribal lands. The Siouan-speaking Catawba were once considered one of the most powerful Southeastern tribes. The Catawba and other Siouan peoples are believed to have emerged and coalesced as individual tribes in the Southeast. Primarily sedentary, cultivating their own crops, the Catawba were friendly toward the early European colonists.
When the first Anglo-Europeans reached this area in the early 1750s, they settled between Rum Creek and Twelve Mile Creek. Waxhaw Creek within this area was named after the Waxhaw Indian tribe that was prominent in the region. The majority of the new settlers were Scots-Irish who had migrated from Pennsylvania, where they had landed in Philadelphia. Other Scots-Irish from the backcountry of North Carolina and Virginia joined them. The Scots-Irish settlers were exclusively Presbyterian. Over 9 out of 10 of them originated in County Antrim, Ireland in what hasa since become Northern Ireland.[5] A significant minority of the population was German.
Many of the early settlers migrated to South Carolina from Lancaster, Lancashire in the northwest region of England. They had named their county for the House of Lancaster, which had opposed the House of York in the struggles of 1455–85, known as the War of the Roses. The House of Lancaster chose the red rose as their emblem while their neighbor, York County, boasts the white rose.
A second settlement was made in the lower part of the present Lancaster County on Hanging Rock Creek. The South Carolina colony first made a grant to settlers there in 1752; it included the overhanging mass of rock for which the creek was named. About the time the colony opened up this section, other settlers came in and settled along Lynches Creek, Little Lynches creek, Flat Creek, Beaver Creek, and lower Camp Creek. In coming to the Lancaster area, the first settlers followed old Indian paths. The increased traffic began to enlarge the paths and improve them as dirt roads. Several settlers from the regions of Norfolk, England, Suffolk, England and Essex, England arrived in what would later become Lancaster County in the late 1750s. These settlers were overwhelmingly Baptists, Methodists and Anglicans. After the American Revolution, those who were Anglican became members of the Episcopal Church.[6]
The Rocky River Road was also based on an Indian path. During the American Revolutionary War, Colonel Abraham Buford and his forces fled from Tarleton along this road. He was overtaken a few miles south of the North Carolina state line, where the Patriot forces were defeated in the Battle of Waxhaws. Locals call it Buford's Massacre. Today, the Rocky River Road has been absorbed by part of South Carolina Highway 522, which was constructed following the old thoroughfare very closely.
Geography
According to the U.S. Census Bureau, the county has a total area of 555.05 square miles (1,437.6 km2), of which 549.07 square miles (1,422.1 km2) is land and 5.98 square miles (15.5 km2) (1.08%) is water.[7] It is bounded on the west by the Catawba River and Sugar Creek and on the east by the Lynches River.
State and local protected areas/sites
- Forty Acre Rock Heritage Preserve/Wildlife Management Area[8]
- Andrew Jackson State Park
- Buford Battleground
- Hanging Rock Battleground
- Historic Craig House
- Landsford Canal State Park
Major water bodies
- Catawba River
- Fishing Creek Lake
- Flat Rock Creek
- Gills Creek
- Lake Wateree
- Lynches River
- Sugar Creek
Adjacent counties
- Union County, North Carolina – northeast
- Chesterfield County – east
- Kershaw County – south
- Fairfield County – southwest
- York County – west
- Chester County – west
- Mecklenburg County, North Carolina – north
Major highways
Major Infrastructure
Demographics
| Census | Pop. | Note | %± |
|---|---|---|---|
| 1790 | 6,302 | — | |
| 1800 | 6,012 | −4.6% | |
| 1810 | 6,318 | 5.1% | |
| 1820 | 8,716 | 38.0% | |
| 1830 | 10,361 | 18.9% | |
| 1840 | 9,907 | −4.4% | |
| 1850 | 10,988 | 10.9% | |
| 1860 | 11,797 | 7.4% | |
| 1870 | 12,087 | 2.5% | |
| 1880 | 16,903 | 39.8% | |
| 1890 | 20,761 | 22.8% | |
| 1900 | 24,311 | 17.1% | |
| 1910 | 26,650 | 9.6% | |
| 1920 | 28,628 | 7.4% | |
| 1930 | 27,980 | −2.3% | |
| 1940 | 33,542 | 19.9% | |
| 1950 | 37,071 | 10.5% | |
| 1960 | 39,352 | 6.2% | |
| 1970 | 43,328 | 10.1% | |
| 1980 | 53,361 | 23.2% | |
| 1990 | 54,516 | 2.2% | |
| 2000 | 61,351 | 12.5% | |
| 2010 | 76,652 | 24.9% | |
| 2020 | 96,016 | 25.3% | |
| 2022 (est.) | 104,577 | [2] | 8.9% |
| U.S. Decennial Census[9] 1790–1960[10] 1900–1990[11] 1990–2000[12] 2010–2020[2] | |||
2020 census
| Race | Num. | Perc. |
|---|---|---|
| White (non-Hispanic) | 64,927 | 67.62% |
| Black or African American (non-Hispanic) | 19,101 | 19.89% |
| Native American | 220 | 0.23% |
| Asian | 1,765 | 1.84% |
| Pacific Islander | 14 | 0.01% |
| Other/Mixed | 3,695 | 3.85% |
| Hispanic or Latino | 6,294 | 6.56% |
As of the 2020 census, there were 96,016 people, 35,410 households, and 24,327 families residing in the county.
2010 census
At the 2010 census, there were 76,652 people, 29,697 households, and 21,122 families living in the county.[14][15] The population density was 139.6 inhabitants per square mile (53.9/km2). There were 32,687 housing units at an average density of 59.5 per square mile (23.0/km2).[16] The racial makeup of the county was 71.5% white, 23.8% black or African American, 0.6% Asian, 0.3% American Indian, 2.4% from other races, and 1.3% from two or more races. Those of Hispanic or Latino origin made up 4.4% of the population.[14] In terms of ancestry, 23.9% were American, 8.0% were Irish, 7.6% were English, and 7.2% were German.[17]
Of the 29,697 households, 33.2% had children under the age of 18 living with them, 51.0% were married couples living together, 15.4% had a female householder with no husband present, 28.9% were non-families, and 24.7% of all households were made up of individuals. The average household size was 2.51 and the average family size was 2.97. The median age was 39.7 years.[14]
The median income for a household in the county was $38,959 and the median income for a family was $46,388. Males had a median income of $39,681 versus $28,985 for females. The per capita income for the county was $19,308. About 15.8% of families and 20.4% of the population were below the poverty line, including 30.2% of those under age 18 and 11.2% of those age 65 or over.[18]
2000 census
At the 2000 census,[19] there were 61,351 people, 23,178 households, and 16,850 families living in the county. The population density was 112 inhabitants per square mile (43/km2). There were 24,962 housing units at an average density of 46 per square mile (18/km2). The racial makeup of the county was 71.03% White American, 26.86% African American, 0.22% Native American, 0.27% Asian American, 0.02% Pacific Islander, 0.89% from other races, and 0.71% from two or more races. 1.59% of the population were Hispanic or Latino of any race.
There were 23,178 households, out of which 33.40% had children under the age of 18 living with them, 52.60% were married couples living together, 15.50% had a female householder with no husband present, and 27.30% were non-families. 23.70% of all households were made up of individuals, and 9.40% had someone living alone who was 65 years of age or older. The average household size was 2.56 and the average family size was 3.01.
In the county, the population was spread out, with 25.40% under the age of 18, 8.60% from 18 to 24, 30.30% from 25 to 44, 23.60% from 45 to 64, and 12.10% who were 65 years of age or older. The median age was 36 years. For every 100 females there were 98.20 males. For every 100 females age 18 and over, there were 95.40 males.
The median income for a household in the county was $34,688, and the median income for a family was $40,955. Males had a median income of $30,176 versus $22,238 for females. The per capita income for the county was $16,276. About 9.70% of families and 12.80% of the population were below the poverty threshold, including 16.50% of those under age 18 and 15.80% of those age 65 or over.
Government and politics
| Year | Republican | Democratic | Third party | |||
|---|---|---|---|---|---|---|
| No. | % | No. | % | No. | % | |
| 2020 | 30,312 | 60.78% | 18,937 | 37.97% | 619 | 1.24% |
| 2016 | 23,719 | 60.91% | 13,812 | 35.47% | 1,407 | 3.61% |
| 2012 | 19,333 | 58.33% | 13,419 | 40.49% | 392 | 1.18% |
| 2008 | 16,441 | 56.85% | 12,139 | 41.97% | 341 | 1.18% |
| 2004 | 12,916 | 62.05% | 7,631 | 36.66% | 267 | 1.28% |
| 2000 | 11,676 | 56.39% | 8,782 | 42.41% | 247 | 1.19% |
| 1996 | 7,544 | 42.01% | 8,752 | 48.74% | 1,661 | 9.25% |
| 1992 | 7,757 | 41.58% | 8,307 | 44.53% | 2,591 | 13.89% |
| 1988 | 9,152 | 59.46% | 6,181 | 40.15% | 60 | 0.39% |
| 1984 | 10,383 | 63.92% | 5,804 | 35.73% | 57 | 0.35% |
| 1980 | 6,410 | 42.25% | 8,283 | 54.60% | 477 | 3.14% |
| 1976 | 4,997 | 37.33% | 8,324 | 62.19% | 64 | 0.48% |
| 1972 | 9,016 | 77.86% | 2,461 | 21.25% | 103 | 0.89% |
| 1968 | 4,874 | 37.75% | 3,151 | 24.41% | 4,886 | 37.84% |
| 1964 | 4,742 | 48.83% | 4,970 | 51.17% | 0 | 0.00% |
| 1960 | 2,909 | 34.34% | 5,561 | 65.66% | 0 | 0.00% |
| 1956 | 1,610 | 24.26% | 4,398 | 66.26% | 629 | 9.48% |
| 1952 | 3,080 | 38.17% | 4,989 | 61.83% | 0 | 0.00% |
| 1948 | 30 | 1.18% | 855 | 33.74% | 1,649 | 65.07% |
| 1944 | 13 | 0.51% | 2,383 | 93.97% | 140 | 5.52% |
| 1940 | 14 | 0.43% | 3,205 | 99.57% | 0 | 0.00% |
| 1936 | 0 | 0.00% | 2,631 | 100.00% | 0 | 0.00% |
| 1932 | 5 | 0.16% | 3,103 | 99.84% | 0 | 0.00% |
| 1928 | 8 | 0.55% | 1,436 | 99.45% | 0 | 0.00% |
| 1924 | 8 | 0.59% | 1,355 | 99.41% | 0 | 0.00% |
| 1920 | 10 | 0.61% | 1,633 | 99.39% | 0 | 0.00% |
| 1916 | 1 | 0.07% | 1,426 | 99.86% | 1 | 0.07% |
| 1912 | 6 | 0.52% | 1,140 | 99.04% | 5 | 0.43% |
| 1904 | 69 | 4.39% | 1,504 | 95.61% | 0 | 0.00% |
| 1900 | 70 | 5.11% | 1,300 | 94.89% | 0 | 0.00% |
Communities
City
- Lancaster (county seat and largest community)
Towns
Census-designated places
Other unincorporated communities
Former community
Notable people
- Bill Belk, professional football player (San Francisco 49ers)
- Sheldon Brown, professional football player
- Wayne A. Cauthen, first appointed African-American City Manager, Kansas City, MO
- Danny Clyburn, professional baseball player (Baltimore Orioles, Tampa Bay Devil Rays, Pittsburgh Pirates)
- Shawn Crawford, sprinter and Olympic gold medalist
- Don Dixon, record producer, songwriter, musician
- Charles Duke, astronaut and Moon walker during Apollo 16
- James "Butch" Duncan, Professional NFL Baltimore Colts player Super Bowl V
- Pep Harris, professional baseball player (Cleveland Indians, Anaheim Angels)
- Jim Hodges, former Governor of South Carolina
- Andrew Jackson, seventh President of the United States[21]
- Nina Mae McKinney, actress and Broadway star
- Todd Ray, aka 'T-Ray', Grammy Award-winning record producer
- Julie Roberts, country music singer
- Aaron Robinson, Major League Baseball player (New York Yankees, Detroit Tigers, Chicago White Sox, Boston Red Sox)
- Darrell Shropshire, professional football player
- Nelson Sullivan, video artist and 1980s Club Kids personality.
- J. Marion Sims, surgeon known as the "Father of Modern Gynecology"
- The Zodiacs, led by Maurice Williams, R&B vocal group
- Jeff Twitty, professional baseball player (Kansas City Royals)
- Brian Williams, professional baseball player (Houston Astros, Detroit Tigers, Baltimore Orioles, Chicago Cubs, Boston Red Sox)
See also
References
- ↑ "Parlez-Vous Palmetto? The SC Pronunciation Guide ..." SCIWAY. Retrieved September 5, 2019.
- 1 2 3 "QuickFacts: Lancaster County, South Carolina". United States Census Bureau. Retrieved June 12, 2022.
- ↑ "Find a County". National Association of Counties. Retrieved June 7, 2011.
- ↑ "South Carolina: Individual County Chronologies". South Carolina Atlas of Historical County Boundaries. The Newberry Library. 2009. Archived from the original on January 3, 2017. Retrieved March 21, 2015.
- ↑ Douglas, W. (1954). Migration Patterns from Northern Ireland to Carolina. New Haven, CT: Yale University Press.
- ↑ The Background of the History of Lancaster County, South Carolina - Charlotte, N.C., December 1, 1933 By J. P. Richards · 1933
- ↑ "2020 County Gazetteer Files – South Carolina". United States Census Bureau. August 23, 2022. Retrieved September 10, 2023.
- ↑ "SCDNR Public Lands". www2.dnr.sc.gov. Retrieved April 1, 2023.
- ↑ "U.S. Decennial Census". United States Census Bureau. Retrieved March 18, 2015.
- ↑ "Historical Census Browser". University of Virginia Library. Retrieved March 18, 2015.
- ↑ Forstall, Richard L., ed. (March 27, 1995). "Population of Counties by Decennial Census: 1900 to 1990". United States Census Bureau. Retrieved March 18, 2015.
- ↑ "Census 2000 PHC-T-4. Ranking Tables for Counties: 1990 and 2000" (PDF). United States Census Bureau. April 2, 2001. Archived (PDF) from the original on October 9, 2022. Retrieved March 18, 2015.
- ↑ "Explore Census Data". data.census.gov. Retrieved December 13, 2021.
- 1 2 3 "DP-1 Profile of General Population and Housing Characteristics: 2010 Demographic Profile Data". United States Census Bureau. Archived from the original on February 13, 2020. Retrieved March 11, 2016.
- ↑ "State & County QuickFacts". United States Census Bureau. Archived from the original on June 6, 2011. Retrieved November 25, 2013.
- ↑ "Population, Housing Units, Area, and Density: 2010 - County". United States Census Bureau. Archived from the original on February 13, 2020. Retrieved March 11, 2016.
- ↑ "DP02 SELECTED SOCIAL CHARACTERISTICS IN THE UNITED STATES – 2006-2010 American Community Survey 5-Year Estimates". United States Census Bureau. Archived from the original on February 13, 2020. Retrieved March 11, 2016.
- ↑ "DP03 SELECTED ECONOMIC CHARACTERISTICS – 2006-2010 American Community Survey 5-Year Estimates". United States Census Bureau. Archived from the original on February 13, 2020. Retrieved March 11, 2016.
- ↑ "U.S. Census website". United States Census Bureau. Retrieved May 14, 2011.
- ↑ Leip, David. "Dave Leip's Atlas of U.S. Presidential Elections". uselectionatlas.org. Retrieved March 13, 2018.
- ↑ Collings, Jeffrey (March 7, 2011). "Old fight lingers over Old Hickory's roots". ISSN 0190-8286. Retrieved April 27, 2023.

