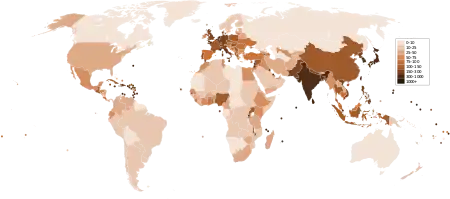
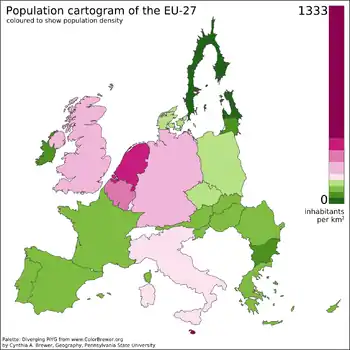
.png.webp)

Population density (in agriculture: standing stock or plant density) is a measurement of population per unit land area. It is mostly applied to humans, but sometimes to other living organisms too. It is a key geographical term.[1]
Biological population densities
Population density is population divided by total land area, sometimes including seas and oceans, as appropriate.[1]
Low densities may cause an extinction vortex and further reduce fertility. This is called the Allee effect after the scientist who identified it. Examples of the causes of reduced fertility in low population densities are:[2]
- Increased problems with locating sexual mates
- Increased inbreeding
Human densities


Population density is the number of people per unit of area, usually transcribed as "per square kilometer" or square mile, and which may include or exclude, for example, areas of water or glaciers. Commonly this is calculated for a county, city, country, another territory or the entire world.
The world's population is around 8,000,000,000[3] and the Earth's total area (including land and water) is 510,000,000 km2 (200,000,000 sq mi).[4] Therefore, the worldwide human population density is approximately 8,000,000,000 ÷ 510,000,000 = 16/km2 (41/sq mi). However, if only the Earth's land area of 150,000,000 km2 (58,000,000 sq mi) is taken into account, then human population density is 53/km2 (140/sq mi). This includes all continental and island land area, including Antarctica. However, if Antarctica is excluded, then population density rises to over 58 per square kilometre (150/sq mi).[1]

The European Commission's Joint Research Centre (JRC) has developed a suite of (open and free) data and tools named the Global Human Settlement Layer (GHSL) to improve the science for policy support to the European Commission Directorate Generals and Services and as support to the United Nations system.[5]
Several of the most densely populated territories in the world are city-states, microstates and urban dependencies.[6][note 1] In fact, 95% of the world's population is concentrated on just 10% of the world's land.[7] These territories have a relatively small area and a high urbanization level, with an economically specialized city population drawing also on rural resources outside the area, illustrating the difference between high population density and overpopulation.
Deserts have very limited potential for growing crops as there is not enough rain to support them. Thus, their population density is generally low. However, some cities in the Middle East, such as Dubai, have been increasing in population and infrastructure growth at a fast pace.[8]
Cities with high population densities are, by some, considered to be overpopulated, though this will depend on factors like quality of housing and infrastructure and access to resources.[10] Very densely populated cities are mostly in Asia (particularly Southeast Asia); Africa's Lagos, Kinshasa, and Cairo; South America's Bogotá, Lima, and São Paulo; and Mexico City and Saint Petersburg also fall into this category.[11]

City population and especially area are, however, heavily dependent on the definition of "urban area" used: densities are almost invariably higher for the center only than when suburban settlements and intervening rural areas are included, as in the agglomeration or metropolitan area (the latter sometimes including neighboring cities).
In comparison, based on a world population of 7.8 billion, the world's inhabitants, if conceptualized as a loose crowd occupying just under 1 m2 (10 sq ft) per person (cf. Jacobs Method), would occupy a space a little larger than Delaware's land area.
Countries and dependent territories
| Rank | Country or dependent territory |
Land Area | Population | Density | ||
|---|---|---|---|---|---|---|
| km2 | sq mi | per km2 | per sq mi | |||
| 1 | 30.5 | 12 | 650,834 | 21,339 | 55,268 | |
| 2 | 2.02 | 0.78 | 37,550 | 18,589 | 48,145 | |
| 3 | 719.9 | 278 | 5,612,300 | 7,796 | 20,192 | |
| 4 | 1,106.3 | 427 | 7,409,800 | 6,698 | 17,348 | |
| 5 | 6.8 | 2.6 | 33,140 | 4,874 | 12,624 | |
| 6 | 757 | 292 | 1,451,200 | 1,917 | 4,965 | |
| 7 | 0.44 | 0.17 | 800 | 1,818 | 4,709 | |
| 8 | 315 | 122 | 475,701 | 1,510 | 3,911 | |
| 9 | 298 | 115 | 378,114 | 1,269 | 3,287 | |
| 10 | 52 | 20 | 63,779 | 1,227 | 3,178 | |
| Rank | Country/Territory | Land Area | Population | Density | ||
|---|---|---|---|---|---|---|
| km2 | sq mi | per km2 | per sq mi | |||
| 1 | 134,208 | 51,818 | 170,329,768 | 1,269 | 3,287 | |
| 2 | 32,260 | 12,456 | 23,539,588 | 730 | 1,891 | |
| 3 | 24,668 | 9,524 | 13,246,394 | 537 | 1,391 | |
| 4 | 33,670 | 13,000 | 17,943,243[13] | 533 | 1,380 | |
| 5 | 99,909 | 38,575 | 51,439,038 | 515 | 1,334 | |
| 6 | 25,680 | 9,915 | 12,574,571 | 490 | 1,269 | |
| 7 | 2,973,190 | 1,147,955 | 1,374,547,140 | 462 | 1,197 | |
| 8 | 27,560 | 10,641 | 11,743,017 | 426 | 1,103 | |
| 9 | 30,278 | 11,690 | 11,554,449 | 382 | 989 | |
| 10 | 298,170 | 115,124 | 109,961,895 | 369 | 956 | |
Other methods of measurement


Although the arithmetic density is the most common way of measuring population density, several other methods have been developed to provide alternative measures of population density over a specific area.
- Arithmetic density: The total number of people / area of land
- Physiological density: The total population / area of arable land
- Agricultural density: The total rural population / area of arable land
- Residential density: The number of people living in an urban area / area of residential land
- Urban density: The number of people inhabiting an urban area / total area of urban land
- Ecological optimum: The density of population that can be supported by the natural resources
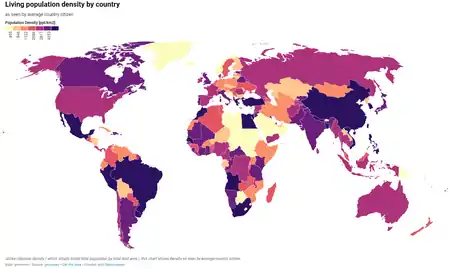
- Living density: Population density at which the average person lives[14]
See also
- Distance sampling
- Demography
- Human geography
- Idealised population
- List of population concern organizations
- Plant density
- Population dynamics
- Population decline
- Population growth
- Population genetics
- Population health
- Population momentum
- Population pyramid
- Rural transport problem
- Significant figures
- Small population size
- Global Human Settlement Layer
Lists of entities by population density
- List of Australian suburbs by population density
- List of countries by population density
- List of cities by population density
- List of city districts by population density
- List of English districts by population density
- List of European Union cities proper by population density
- List of islands by population density
- List of states and territories of the United States by population density
Explanatory notes
- ↑ The Monaco government uses a smaller surface area figure resulting in a population density of 18,078/km2 (46,820/sq mi).
References
- 1 2 3 Matt Rosenberg Population Density. Geography.about.com. March 2, 2011. Retrieved on December 10, 2011.
- ↑ Minimum viable population size. Archived October 6, 2012, at the Wayback Machine Eoearth.org (March 6, 2010). Retrieved on December 10, 2011.
- ↑ U.S. & World Population Clocks. Census.gov. Retrieved on November 19, 2022.
- ↑ World. CIA World Factbook
- ↑ Melchiorri, Michele (September 15, 2022). "The global human settlement layer sets a new standard for global urban data reporting with the urban centre database". frontiersin.org. Vol. 10. doi:10.3389/fenvs.2022.1003862.
- ↑ Department of Economic and Social Affairs Population Division (2009). "World Population Prospects, Table A.1" (PDF). 2008 revision. United Nations. Retrieved March 12, 2009.
- ↑ "Urbanization: 95% Of The World's Population Lives On 10% Of The Land". ScienceDaily. Retrieved September 1, 2020.
- ↑ Portnov, B. A.; Hare, A. Paul (1999). Desert regions : population, migration, and environment. Springer. ISBN 3540657800. OCLC 41320143.
- ↑ "Why Mongolia is sparsely populated?". Esther Fleming. SidmartinBio.
- ↑ Human Population. Global Issues. Retrieved on December 10, 2011.
- ↑ The largest cities in the world by land area, population and density Archived May 16, 2015, at the Wayback Machine. Citymayors.com. Retrieved on December 10, 2011.
- ↑ Territory claimed by Spain.
- ↑ Centraal Bureau voor de Statistiek (CBS) (November 2023). "Population counter". Centraal Bureau voor de Statistiek. Retrieved November 1, 2023.
- ↑ Analysis of living population density per countries, based on NASA SEDAC world gridded data.
External links
- Selected Current and Historic City, Ward & Neighborhood Density
- Duncan Smith / UCL Centre for Advanced Spatial Analysis. "World Population Density".
exploratory map shows data from the [...] Global Human Settlement Layer (GHSL) produced by the European Commission JRC and the CIESIN Columbia University
.jpg.webp)