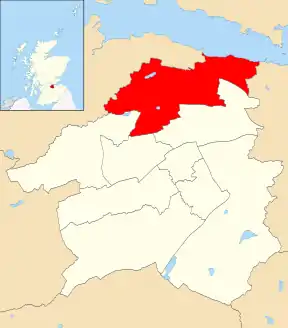
Location of the ward [1]
Linlithgow is one of the nine wards used to elect members of the West Lothian Council. It elects four Councillors. In 2019, the population of the ward was 16,499.[2]
Councillors
| Election | Councillors | |||||
|---|---|---|---|---|---|---|
| 2007 | Martyn Day (SNP) |
Tom Conn (Labour) |
Tom Kerr (Conservative) | |||
| 2012 | ||||||
| 2017 | David Tait (SNP) | |||||
| 2022 | Pauline Orr (SNP) |
Sally Pattle (Liberal Democrats) | ||||
Election Results
2022 Election
2022 West Lothian Council election
| Party | Candidate | FPv% | Count | |||||
|---|---|---|---|---|---|---|---|---|
| 1 | 2 | 3 | 4 | 5 | ||||
| SNP | Pauline Orr | 26.26% | 1,869 | |||||
| Liberal Democrats | Sally Pattle | 20.33% | 1,447 | 1,457 | 1,466 | 1,901 | ||
| Conservative | Chris Horne | 19.83% | 1,411 | 1,413 | 1,445 | 1,484 | 1,508 | |
| Labour | Tom Conn (incumbent) | 19.54% | 1,391 | 1,406 | 1,413 | 1,733 | 1,788 | |
| Scottish Green | Pamela Barnes | 13.22% | 941 | 988 | 992 | |||
| Scottish Family | Rik Smith | 0.81% | 58 | 59 | ||||
| Electorate: 12,435 Valid: 7,117 Spoilt: 53 Quota: 1,780 Turnout: 57.7%[5] | ||||||||
2017 Election
2017 West Lothian Council election[6]
| Party | Candidate | FPv% | Count | |||||||
|---|---|---|---|---|---|---|---|---|---|---|
| 1 | 2 | 3 | 4 | 5 | 6 | 7 | ||||
| Conservative | Tom Kerr (incumbent) | 41.92% | 3,037 | |||||||
| Labour | Tom Conn (incumbent) | 14.63% | 1,060 | 1,425 | 1,450 | 1,558 | 1,956 | |||
| SNP | David Tait (incumbent) | 16.01% | 1,160 | 1,215 | 1,217 | 1,310 | 1,390 | 1,405 | 2,529 | |
| SNP | Sue Friel | 15.06% | 1,091 | 1,126 | 1,129 | 1,246 | 1,319 | 1,341 | ||
| Liberal Democrats | Sally Pattle | 5.26% | 381 | 692 | 714 | 872 | ||||
| Scottish Green | Maire McCormack | 6.57% | 476 | 535 | 541 | |||||
| UKIP | Alan Cooper | 0.55% | 40 | 113 | ||||||
| Electorate: TBC Valid: 7,245 Spoilt: 74 Quota: 1,812 Turnout: 59.0% | ||||||||||
2012 Election
2012 West Lothian Council election[8]
| Party | Candidate | FPv% | Count | |||||
|---|---|---|---|---|---|---|---|---|
| 1 | 2 | 3 | 4 | 5 | ||||
| Conservative | Tom Kerr (incumbent) | 33.18 | 2,112 | |||||
| SNP | Martyn Day (incumbent)†† | 28.70 | 1,827 | |||||
| Labour | Tom Conn (incumbent) | 20.30 | 1,292 | 1,453 | 1,478.7 | 1,483.2 | 1,627.9 | |
| SNP | David Tait | 13.02 | 829 | 920.3 | 1,101.4 | 1,106.9 | 1,186.9 | |
| Action to Save St John's Hospital | Cherie Finlay | 4.40 | 280 | 396.7 | 413.6 | 423.8 | ||
| National Front | Ernest Wilson | 0.39 | 25 | 30.2 | 30.6 | |||
| Electorate: 11,944 Valid: 6,365 Spoilt: 44 Quota: 1,592 Turnout: 6,409 (53.29%) | ||||||||
2007 Election
2007 West Lothian Council election
| Party | Candidate | 1st Pref | % | Seat | Count | |
|---|---|---|---|---|---|---|
| Conservative | Tom Kerr | 2,120 | 26.9 | 1 | 1 | |
| SNP | Martyn Day | 1,792 | 22.7 | 2 | 6 | |
| SNP | Tam Smith | 1,340 | 17.0 | |||
| Labour | Tom Conn | 1,328 | 16.9 | 3 | 6 | |
| Liberal Democrats | Geoff King | 739 | 9.4 | |||
| Scottish Green | Simon King-Spooner | 316 | 4.0 | |||
| Conservative | Sandy Pagan | 194 | 2.4 | |||
| Scottish Socialist | Eddy Cornock | 49 | 2.5 | |||
References
- ↑ "5th Reviews - ward maps | Scottish Boundary Commission". Lgbc-scotland.gov.uk. Retrieved 10 March 2020.
- ↑ "statistics.gov.scot/Linlithgow". Scottish Government. Retrieved 27 July 2021.
- ↑ "NOTICE OF POLL - West Lothian Council" (PDF). West Lothian Council. West Lothian Council. 30 March 2022.
- ↑ "Candidate Votes Per Stage Report (Ward 1 Linlithgow)" (PDF). West Lothian Council. Retrieved 8 May 2022.
- ↑ "Declaration of Results (Ward 1 Linlithgow)" (PDF). West Lothian Council. Retrieved 8 May 2022.
- ↑ https://www.westlothian.gov.uk/article/13871/Council-Election-results-2017
- ↑ "Ward 1 Linlithgow results 2017 - West Lothian Council". Archived from the original on 7 February 2019. Retrieved 11 March 2020.
- ↑ "Previous Election Results".
This article is issued from Wikipedia. The text is licensed under Creative Commons - Attribution - Sharealike. Additional terms may apply for the media files.
