Lishu County
梨树县 | |
|---|---|
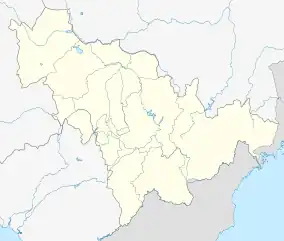 Lishu Location in Jilin province | |
| Coordinates: 43°25′N 124°22′E / 43.417°N 124.367°E | |
| Country | People's Republic of China |
| Province | Jilin |
| Prefecture-level city | Siping |
| Seat | Lishu Town (梨树镇) |
| Area | |
| • Total | 3,900 km2 (1,500 sq mi) |
| Elevation | 171 m (561 ft) |
| Population | |
| • Total | 800,000 |
| • Density | 210/km2 (530/sq mi) |
| Time zone | UTC+8 (China Standard) |
| Postal code | 136500 |
Lishu County (simplified Chinese: 梨树县; traditional Chinese: 梨樹縣; pinyin: Líshù Xiàn) is a county of western Jilin province, China, bordering Liaoning to the southwest. It is under the administration of Siping City, with a population of 800,000 residing in an area of 3,900 km2 (1,500 sq mi).
Administrative divisions
Lishu County administers 17 towns and six townships.[1]
Towns:
|
|
Townships:
- Baishan Township (白山乡)
- Shengli Township (胜利乡)
- Quanyanling Township (泉眼岭乡)
- Jinshan Township (金山乡)
- Shuanghe Township (双河乡)
- Sikeshu Township (四棵树乡)
Climate
| Climate data for Lishu (1991–2020 normals, extremes 1981–2010) | |||||||||||||
|---|---|---|---|---|---|---|---|---|---|---|---|---|---|
| Month | Jan | Feb | Mar | Apr | May | Jun | Jul | Aug | Sep | Oct | Nov | Dec | Year |
| Record high °C (°F) | 5.2 (41.4) |
16.3 (61.3) |
20.7 (69.3) |
29.5 (85.1) |
34.6 (94.3) |
37.0 (98.6) |
35.6 (96.1) |
35.8 (96.4) |
32.0 (89.6) |
27.4 (81.3) |
20.5 (68.9) |
12.0 (53.6) |
37.0 (98.6) |
| Mean daily maximum °C (°F) | −8.1 (17.4) |
−2.7 (27.1) |
5.5 (41.9) |
15.5 (59.9) |
22.8 (73.0) |
27.0 (80.6) |
28.5 (83.3) |
27.5 (81.5) |
23.0 (73.4) |
14.5 (58.1) |
3.0 (37.4) |
−5.9 (21.4) |
12.5 (54.6) |
| Daily mean °C (°F) | −13.6 (7.5) |
−8.5 (16.7) |
−0.1 (31.8) |
9.5 (49.1) |
17.0 (62.6) |
21.9 (71.4) |
24.1 (75.4) |
22.8 (73.0) |
17.1 (62.8) |
8.6 (47.5) |
−1.9 (28.6) |
−10.8 (12.6) |
7.2 (44.9) |
| Mean daily minimum °C (°F) | −18.6 (−1.5) |
−13.9 (7.0) |
−5.5 (22.1) |
3.5 (38.3) |
11.2 (52.2) |
16.8 (62.2) |
20.0 (68.0) |
18.4 (65.1) |
11.3 (52.3) |
3.2 (37.8) |
−6.5 (20.3) |
−15.4 (4.3) |
2.0 (35.7) |
| Record low °C (°F) | −38.3 (−36.9) |
−34.1 (−29.4) |
−21.2 (−6.2) |
−11.2 (11.8) |
−2.3 (27.9) |
4.0 (39.2) |
10.6 (51.1) |
7.1 (44.8) |
−2.8 (27.0) |
−17.0 (1.4) |
−23.3 (−9.9) |
−34.2 (−29.6) |
−38.3 (−36.9) |
| Average precipitation mm (inches) | 4.0 (0.16) |
4.5 (0.18) |
11.4 (0.45) |
21.3 (0.84) |
58.2 (2.29) |
88.8 (3.50) |
137.1 (5.40) |
141.8 (5.58) |
43.7 (1.72) |
26.3 (1.04) |
15.3 (0.60) |
5.6 (0.22) |
558 (21.98) |
| Average precipitation days (≥ 0.1 mm) | 3.6 | 2.9 | 4.3 | 5.5 | 9.7 | 12.4 | 12.3 | 11.4 | 6.9 | 6.0 | 4.8 | 4.3 | 84.1 |
| Average snowy days | 5.2 | 4.3 | 4.7 | 1.7 | 0 | 0 | 0 | 0 | 0 | 1.1 | 4.5 | 6.3 | 27.8 |
| Average relative humidity (%) | 63 | 55 | 48 | 44 | 50 | 63 | 77 | 78 | 68 | 59 | 61 | 64 | 61 |
| Mean monthly sunshine hours | 183.1 | 200.9 | 238.5 | 233.3 | 257.1 | 242.6 | 227.0 | 222.4 | 234.9 | 213.7 | 172.1 | 157.9 | 2,583.5 |
| Percent possible sunshine | 63 | 67 | 64 | 58 | 56 | 53 | 49 | 52 | 63 | 63 | 60 | 57 | 59 |
| Source: China Meteorological Administration[2][3] | |||||||||||||
| Climate data for Gujiazizhen, Lishu (1991–2020 normals) | |||||||||||||
|---|---|---|---|---|---|---|---|---|---|---|---|---|---|
| Month | Jan | Feb | Mar | Apr | May | Jun | Jul | Aug | Sep | Oct | Nov | Dec | Year |
| Mean daily maximum °C (°F) | −8.2 (17.2) |
−2.7 (27.1) |
5.4 (41.7) |
15.5 (59.9) |
22.8 (73.0) |
27.1 (80.8) |
28.5 (83.3) |
27.4 (81.3) |
23.0 (73.4) |
14.3 (57.7) |
2.7 (36.9) |
−6.3 (20.7) |
12.5 (54.4) |
| Daily mean °C (°F) | −14.3 (6.3) |
−9.0 (15.8) |
−0.5 (31.1) |
9.3 (48.7) |
16.8 (62.2) |
21.9 (71.4) |
24.0 (75.2) |
22.6 (72.7) |
16.7 (62.1) |
8.3 (46.9) |
−2.5 (27.5) |
−11.6 (11.1) |
6.8 (44.3) |
| Mean daily minimum °C (°F) | −19.4 (−2.9) |
−14.7 (5.5) |
−6.1 (21.0) |
3.0 (37.4) |
10.8 (51.4) |
16.8 (62.2) |
19.7 (67.5) |
18.0 (64.4) |
10.8 (51.4) |
2.8 (37.0) |
−7.1 (19.2) |
−16.3 (2.7) |
1.5 (34.7) |
| Average precipitation mm (inches) | 3.2 (0.13) |
3.5 (0.14) |
10.2 (0.40) |
19.1 (0.75) |
50.9 (2.00) |
79.7 (3.14) |
128.4 (5.06) |
119.8 (4.72) |
47.2 (1.86) |
25.0 (0.98) |
12.2 (0.48) |
5.1 (0.20) |
504.3 (19.86) |
| Average precipitation days (≥ 0.1 mm) | 3.6 | 2.7 | 4.1 | 5.4 | 9.9 | 12.1 | 11.9 | 11.3 | 7.1 | 5.7 | 4.8 | 4.6 | 83.2 |
| Average snowy days | 5.4 | 4.3 | 5.6 | 1.7 | 0.1 | 0 | 0 | 0 | 0 | 1.2 | 4.6 | 6.4 | 29.3 |
| Average relative humidity (%) | 62 | 53 | 46 | 43 | 49 | 63 | 78 | 79 | 69 | 59 | 60 | 63 | 60 |
| Mean monthly sunshine hours | 200.1 | 215.7 | 254.4 | 248.0 | 265.6 | 249.7 | 225.9 | 227.1 | 244.2 | 222.4 | 182.5 | 179.4 | 2,715 |
| Percent possible sunshine | 69 | 72 | 68 | 61 | 58 | 54 | 49 | 53 | 66 | 66 | 64 | 65 | 62 |
| Source: China Meteorological Administration[4][5] | |||||||||||||
References
- ↑ 2011年统计用区划代码和城乡划分代码:梨树县 (in Chinese). National Bureau of Statistics of the People's Republic of China. Archived from the original on November 27, 2012. Retrieved 2012-07-16.
- ↑ 中国气象数据网 – WeatherBk Data (in Simplified Chinese). China Meteorological Administration. Retrieved 7 July 2023.
- ↑ 中国气象数据网 (in Simplified Chinese). China Meteorological Administration. Retrieved 7 July 2023.
- ↑ 中国气象数据网 – WeatherBk Data (in Simplified Chinese). China Meteorological Administration. Retrieved 5 October 2023.
- ↑ 中国气象数据网 (in Simplified Chinese). China Meteorological Administration. Retrieved 5 October 2023.
External links
This article is issued from Wikipedia. The text is licensed under Creative Commons - Attribution - Sharealike. Additional terms may apply for the media files.