The following is a list of tropical cyclones that affected the U.S. state of Pennsylvania.
List of tropical cyclones
Pre-1900
- September 18, 1876 – A tropical storm produced 50 knots (93 km/h) sustained winds in parts of Pennsylvania.[1][2][3]
- September 13, 1878 – An extratropical storm produced at least 70 km/h sustained winds throughout the state.[4][5]
- October 24, 1878 – The Gale of 1878 destroyed at least 700 buildings, caused $2 million in damage, killed at least ten people and injured more, and produced 80 km/h sustained winds throughout the state.[6][5][7][8]
- October 13, 1885 – An extratropical storm produced 70 km/h sustained winds throughout the state.[9][10]
- August 22, 1888 – A tropical storm produced 75 km/h sustained winds throughout the state.[11][10][12]
- August 29, 1893 – A tropical storm produced 100 km/h sustained winds throughout the state.[13][14][15]
- October 25, 1893 – A tropical storm produced 65 km/h sustained winds.[16][14]
- September 30, 1896 – The extratropical remnants of the Cedar Keys hurricane produced 95–100 km/h sustained winds.[17][14]
- November 1, 1899 – An extratropical storm produced 95 km/h sustained winds.[18][14]
1900–1950
- June 29, 1902 – A extratropical storm caused 65 knots (120 km/h) winds throughout the state.[19][20]
- September 16, 1903 – The Vagabond Hurricane affected Pennsylvania as a tropical storm with winds of 50–65 km/h, after making landfall in New Jersey with hurricane-force winds.[21][20]
- August 4, 1915 – A tropical depression caused winds of 45 km/h.[22]
- October 1, 1915 – An extratropical storm caused winds of 65 km/h.[23]
- October 24, 1923 – An extratropical storm caused winds of 75 km/h.[24]
- September 20, 1928 – An extratropical storm caused winds of 75 km/h.[25]
- October 3, 1929 – An extratropical storm caused winds of 55 km/h.[26]
- September 21, 1932 – A tropical depression caused winds of 30 km/h.[27]
- August 24, 1933 – A tropical storm caused winds of 85 km/h.[27]
- August 19, 1939 – A tropical depression caused winds of 45 km/h.[27]
- September 19, 1945 – An extratropical storm caused winds of 45 km/h.[28]
- August 29, 1949 – A tropical storm caused winds of 65 km/h.[28]
1951–1999

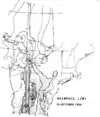
Hazel's rainfall amounts across the Northeast and Mid-Atlantic regions of the United States, including Pennsylvania

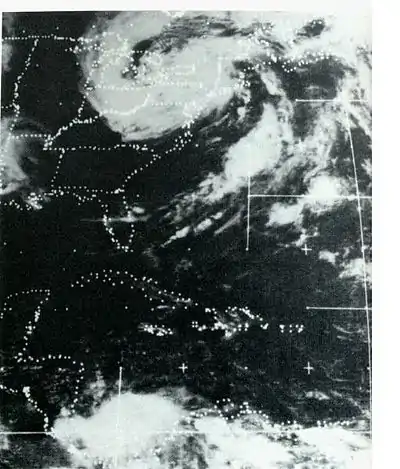
Hurricane Agnes over Pennsylvania
- September 1, 1952 – Tropical Storm Able affected Pennsylvania as a tropical storm and tropical depression after making landfall in South Carolina as a hurricane.[29]
- October 15, 1954 – Hurricane Hazel caused hurricane-force winds and small portions with 6 inches (150 mm) or more of rain.[30]
- August, 1955 – Hurricanes Connie and Diane both caused as much as 10 inches (250 mm) of rain and tropical storm force winds.
- June 21-June 22, 1972 – Hurricane Agnes caused rain and some winds. It caused widespread rains of 6 to 12 inches (300 mm) with local amounts up to 19 inches (480 mm).[31]
- September 6, 1979 – Tropical Storm David caused tropical storm force winds and at least 5 inches of rain.[32]
- September, 1987 – Tropical Depression Nine brought at least 5 inches of rain to part of the state.[33]
- September 26, 1992 – Tropical Storm Danielle caused tropical storm force winds.
- August 18, 1994 – Tropical Depression Beryl caused some rain and tropical depression winds.
- September 1996 – Tropical Storm Fran caused flashing flooding in about 15 Western Pennsylvania counties as rainfall up to 7 inches (178 mm) caused the Juniata River to overrun its banks.
- August 29-August 31, 1999 – Hurricane Dennis caused tropical depression force winds and five inches (127 mm) of rain.

A Federal Emergency Management Agency (FEMA) worker with a flood victim from Floyd in Philadelphia

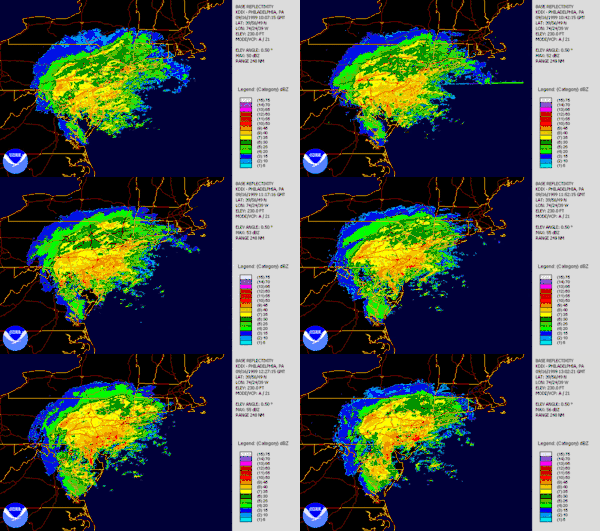
Floyd's rain affecting Pennsylvania, and surrounding states
- September 16, 1999 – Hurricane Floyd, which was a tropical storm by the time it reached Pennsylvania, caused 6 deaths and 10 inches (250 mm) of rain in the eastern part of the commonwealth. It produced a 2.8 ft (0.85 m) storm surge in Philadelphia.[34]
2000 onwards
- June 16, 2001 – Tropical Storm Allison caused rain and extensive damage. At its height, there was 10 inches of rain in some parts of the Philadelphia area. Some 241 homes were destroyed, at least 1,300 were majorly damaged, and 3 buildings of an Apartment Complex caught fire due to an explosion. A total of 7 lives were lost in the Philadelphia area.
- September, 2003 – Tropical Storm Henri's remnants caused rain and $3.5 million in damage. 12 homes were destroyed, 380 majorly damaged and 109,000 PECO customers were without power.[35]
- September 17, 2003 – Hurricane Isabel caused one death in Lancaster County and brought strong winds to parts of the state.

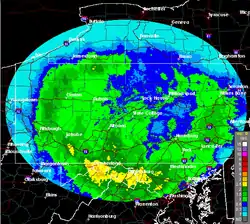
Radar estimated rainfall from Ernesto
- September 18, 2004 – Hurricane Ivan caused some of the worst flooding in Pittsburgh.[36]
- September 1–2, 2006 – Tropical Depression Ernesto caused 2.5 to 3 in (40 to 75 mm) of rain in parts of the south-western portion of the state.
- June 4, 2007 – Tropical Depression Barry caused 1.66 inches (42 mm) of rain, reported at Philadelphia International Airport.[37]
- September 6, 2008 – The remnants of Tropical Storm Hanna led to a confirmed EF1 tornado that touched down in Allentown, Pennsylvania.
- September 14, 2008 – The remnants of Hurricane Ike caused 180,000 people to be without power in western Pennsylvania, wind gusts over 70 mph, and other wind damage. In Oil City, one person was killed by a falling tree limb. A state of emergency was declared for Pennsylvania.
- August 28, 2011 – Hurricane Irene left 706,000 people without power in eastern Pennsylvania, and killed three people in Northampton County, Luzerne County, and Pocono Township. Floodwaters raised the Schuylkill River to levels not seen in 140 years. Philadelphia Mayor Michael Nutter declared a state of emergency for the first time since 1986. Hurricane Irene brought rain and wind gusts of up to 54 mph at the Philadelphia International Airport. Tornado warnings were issued in southeastern Pennsylvania, although no tornadoes were ultimately observed. Irene also brought winds of nearly 70 mph along the coast and 40 to 60 mph inland. The storm left five people dead in the state.
- September 5, 2011 – The remnants of Tropical Storm Lee brought 6 to 10 inches of rain in Pennsylvania, some areas over 14 inches. Lee's leftovers spread into the Mid-Atlantic and Northeast, in some areas causing severe flooding, and record rainfalls throughout much of eastern Pennsylvania. On September 7, 2011, emergency management officials in Northumberland County, Bradford County, Susquehanna County, Columbia County, and Luzerne County declared a state of emergency, and mandatory evacuations because of major flooding; schools were closed due to rising river levels. County officials determined that numerous roads were covered by water or washed out. A number of bridges were affected by high water. In parts of Wilkes-Barre, severe flooding hadn't been seen since Hurricane Agnes of 1972.
- October 29–30, 2012 – Hurricane Sandy brought over 20 inches of rain in southern Pennsylvania and caused 16 deaths. Over 1.2 million people were without electricity throughout the state. On October 29, a State of Emergency was declared. In Philadelphia, all major roads and highways were closed and people in low-lying areas were evacuated. By October 31, people were able to return home. In all of the state, schools and certain jobs were closed for more than a week. Social media referred to Hurricane Sandy as "Superstorm Sandy."
- June 7, 2013 – Tropical Storm Andrea affected south-eastern Pennsylvania with rainfall of 1-3 inches in Bucks, Montgomery, and other southern counties in the state.
- June 23–24, 2017 – The remnants of Tropical Storm Cindy bought flash flooding in eastern Pennsylvania, following with more than 6 inches of rain in southwestern Pennsylvania. An EF1 tornado was confirmed near Long Pine, with damage to trees and homes.
- September 8, 2018 – The remnants of Tropical Storm Gordon are absorbed by a large front. The new system brings rainfall on the state for several days.
- July 9–11, 2020 – Part of Tropical Storm Fay hit New Jersey, causing a microburst to form over parts of the state, such as Pittsburgh, causing flooding through the area.
- September 1, 2021 - Days after Hurricane Ida hit Louisiana as a Category 4 hurricane with 145 mph winds, the remnants traveled to Pennsylvania bringing record flooding and extensive tornado damage. The National Weather service predicted that 9/1 could be one of the top five wettest days on record in central PA behind Hurricane Agnes (1972) and Tropical Storm Lee (2011). The storm brought at least 5 inches of rain at Harrisburg International airport and 7 inches of rain in Lancaster. The Schuylkill river crested at 17.2 feet.
References
- ↑ "Data". www.aoml.noaa.gov. Retrieved 2021-01-08.
- ↑ "Data" (PDF). www.aoml.noaa.gov. Retrieved 2021-01-08.
- ↑ "SAIC | SAIC | IT Modernization". www.saic.com.
- ↑ "Data" (PDF). www.aoml.noaa.gov. Retrieved 2021-01-08.
- 1 2 "metadata". www.aoml.noaa.gov.
- ↑ "Data" (PDF). www.aoml.noaa.gov. Retrieved 2021-01-08.
- ↑ "Data" (PDF). www.aoml.noaa.gov. Retrieved 2021-01-08.
- ↑ "Gale of '78 - Storm 9 of the 1878 Hurricane Season". www.wpc.ncep.noaa.gov.
- ↑ "Data" (PDF). www.aoml.noaa.gov. Retrieved 2021-01-08.
- 1 2 "metadata". www.aoml.noaa.gov.
- ↑ "Data" (PDF). www.aoml.noaa.gov. Retrieved 2021-01-08.
- ↑ "Data" (PDF). www.aoml.noaa.gov. Retrieved 2021-01-08.
- ↑ "Data" (PDF). www.aoml.noaa.gov. Retrieved 2021-01-08.
- 1 2 3 4 "metadata". www.aoml.noaa.gov.
- ↑ "Data" (PDF). www.aoml.noaa.gov. Retrieved 2021-01-08.
- ↑ "Data" (PDF). www.aoml.noaa.gov. Retrieved 2021-01-08.
- ↑ "Data" (PDF). www.aoml.noaa.gov. Retrieved 2021-01-08.
- ↑ "Data" (PDF). www.aoml.noaa.gov. Retrieved 2021-01-08.
- ↑ "Data" (PDF). www.aoml.noaa.gov. Retrieved 2021-01-08.
- 1 2 "metadata". www.aoml.noaa.gov.
- ↑ "Data" (PDF). www.aoml.noaa.gov. Retrieved 2021-01-08.
- ↑ "Data" (PDF). www.aoml.noaa.gov. Retrieved 2021-01-08.
- ↑ "Data" (PDF). www.aoml.noaa.gov. Retrieved 2021-01-08.
- ↑ "Data" (PDF). www.aoml.noaa.gov. Retrieved 2021-01-08.
- ↑ "Data" (PDF). www.aoml.noaa.gov. Retrieved 2021-01-08.
- ↑ "Data" (PDF). www.aoml.noaa.gov. Retrieved 2021-01-08.
- 1 2 3 "Untitled Document". www.aoml.noaa.gov.
- 1 2 "Untitled Document". www.aoml.noaa.gov.
- ↑ "Untitled Document". www.aoml.noaa.gov.
- ↑ "Hurricane Hazel - October 1954". www.wpc.ncep.noaa.gov.
- ↑ Roth, David M (January 3, 2023). "Tropical Cyclone Point Maxima". Tropical Cyclone Rainfall Data. United States Weather Prediction Center. Retrieved January 6, 2023.
 This article incorporates text from this source, which is in the public domain.
 - ↑ "Hurricane David -Early September 1979". www.wpc.ncep.noaa.gov.
- ↑ "Tropical Depression 9- September 7-10, 1987". www.wpc.ncep.noaa.gov.
- ↑ "Archived copy". Archived from the original on 2001-10-24. Retrieved 2007-12-22.
{{cite web}}: CS1 maint: archived copy as title (link) - ↑ "NCDC: Event Details". Archived from the original on 2012-02-04. Retrieved 2006-08-29.
- ↑
- ↑ "Data" (PDF). www.aoml.noaa.gov. Retrieved 2021-01-08.
This article is issued from Wikipedia. The text is licensed under Creative Commons - Attribution - Sharealike. Additional terms may apply for the media files.