| Mansfield | |
|---|---|
| County constituency for the House of Commons | |
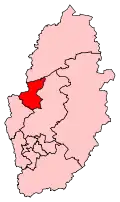 Boundary of Mansfield in Nottinghamshire | |
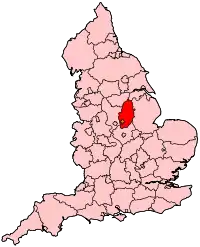 Location of Nottinghamshire within England | |
| County | Nottinghamshire |
| Electorate | 79,849 (December 2010)[1] |
| Major settlements | Mansfield |
| Current constituency | |
| Created | 1885 |
| Member of Parliament | Ben Bradley (Conservative) |
| Seats | One |
| Created from | North Nottinghamshire |
Mansfield is a constituency[n 1] created in 1885 represented in the House of Commons of the UK Parliament since 2017 by Ben Bradley of the Conservative Party, who gained the seat at the 2017 general election, from the Labour Party.[n 2] This is the first time the seat has been represented by a Conservative since its creation in 1885.
The seat is centred on Mansfield in Nottinghamshire.
The Mansfield council area voted with more than 70% to Leave the European Union in the 2016 referendum. In 2019, the Conservatives received 63.9% of the vote in the formerly safe Labour constituency.
Boundaries
The constituency covers the towns of Mansfield and Warsop, Nottinghamshire.
1885–1918: The sessional division of Mansfield (except the parishes of Clipstone, Sookholme and Warsop), and the parishes of Annesley, Eastwood, Felley and Greasley in the sessional division of Nottingham.[2]
1918–1950: The municipal borough of Mansfield, the urban district of Huthwaite, Mansfield Woodhouse, and Sutton-in-Ashfield, and the rural district of Skegby (except the parish of Sookholme).[3]
1950–1955: The municipal borough of Mansfield and the urban district of Sutton in Ashfield.[4]
1955–1983: The municipal borough of Mansfield and the urban districts of Mansfield Woodhouse and Warsop.[5]
1983–2010: The Berry Hill, Broomhill, Cumberlands, Eakring, Forest Town, Ladybrook, Leeming, Lindhurst, Manor, Northfield, Oakham, Oak Tree, Pleasleyhill, Ravensdale, Sherwood and Titchfield wards of the District of Mansfield.[6]
2010–present: The District of Mansfield.[7]
2010 boundary review
The Boundary Commission for England caused changes to constituency to allow for regional and local population changes, noticeably by moving the small town of Market Warsop from Bassetlaw into Mansfield constituency. The boundaries since the Fifth Periodic Review of Westminster constituencies (since the 2010 general election) were coterminous with the Borough of Mansfield, to have wards:
- Berry Hill, Broom Hill, Cumberlands, Eakring, Forest Town East, Forest Town West, Grange Farm, Ladybrook, Leeming, Lindhurst, Oak Tree, Pleasley Hill, Portland, Priory, Ravensdale, Robin Hood, Sherwood.[8]
- Birklands and Meden were added from 2010 having previously been part of Bassetlaw constituency.
Mansfield's elected executive mayor Tony Egginton unilaterally decided to reduce the number of ward councillors (from 46 to 36) whilst simultaneously increasing the number of wards from 17 + 2 (shown above) to 36 by applying to the Boundary Commission to re-structure ward layout and boundaries from 2011:[9]
- Abbott, Berry Hill, Brick Kiln, Broom Hill, Bull Farm and Pleasley Hill, Carr Bank, Eakring, Grange Farm, Holly, Hornby, King's Walk, Kingsway, Ladybrook, Lindhurst, Ling Forest, Manor, Market Warsop, Maun Valley, Meden, Netherfield, Newgate, Newlands, Oak Tree, Oakham, Park Hall, Peafields, Penniment, Portland, Racecourse, Ransom Wood, Sandhurst, Sherwood, Warsop Carrs, Woodhouse, Woodlands, Yeoman Hill
Proposed
Further to the 2023 Periodic Review of Westminster constituencies, enacted by the Parliamentary Constituencies Order 2023, the composition of the constituency from the next general election, due by January 2025, will be reduced to bring the electorate within the permitted electoral range by transferring the Bull Farm and Pleasley Hill ward and polling district BHC in the Berry Hill ward to Ashfield.[10]
History
The seat was created in the Redistribution of Seats Act 1885 and in the mid-19th century to the mid-20th century its economy centred on coal mining and the market town itself. Among many classes of local labourers saw organised Labour Party support, in Trade Unions, party clubs and civic society. Progression in the party's polling was heightened from the early 1920s when the seat joined many wrested from the Liberal Party, enabling the formation of the first Labour government. By length of tenure and in great majorities a safe seat status emerged for Labour (on the basis of these standard criteria) in the 1950s and 1960s. In the 1980s general elections Labour's Mansfield candidates came closer to losing to Conservatives. At the 1983 election, Labour held the seat by just over 2,000 votes – at the following, in 1987, 56 votes. That election was set against the background of the party HQ-backed miners' strike of 1984, not supported by the majority of miners in Nottinghamshire.
In the elections after 1987 until 2017, the Labour MP Alan Meale held Mansfield with relatively large majorities. He was knighted in 2012 after receiving the award in the Queen's Birthday Honours list.[11]
At the 2005 general election, independent candidate Stewart Rickersey, a local District Councillor, took 17% of the vote, finishing in third place.
At the 2010 general election, Andre Camilleri, another candidate from Mansfield Independent Forum and previously a local councillor with special responsibility as a Cabinet Member for Mansfield District Council during 2003 to 2007, was placed fourth with 9% of the vote, above the 5% deposit threshold.
At the 2015 general election, the UKIP candidate Sid Pepper received 25% of the vote placing him third; this dropped to 5% at the 2017 election.
At the 2019 general election, Ben Bradley held Mansfield with a 16,306 majority, the highest ever for a Conservative candidate.
Members of Parliament
Elections

Elections in the 2020s
| Party | Candidate | Votes | % | ±% | |
|---|---|---|---|---|---|
| Conservative | Ben Bradley[13] | ||||
| Labour | Steve Yemm[14] | ||||
| Majority | |||||
| Turnout | |||||
| Swing | |||||
Elections in the 2010s
| Party | Candidate | Votes | % | ±% | |
|---|---|---|---|---|---|
| Conservative | Ben Bradley | 31,484 | 63.9 | +17.3 | |
| Labour | Sonya Ward | 15,178 | 30.8 | −13.7 | |
| Liberal Democrats | Sarah Brown | 1,626 | 3.3 | +1.9 | |
| Independent | Sid Pepper | 527 | 1.1 | −4.2 | |
| Independent | Stephen Harvey | 458 | 0.9 | New | |
| Majority | 16,306 | 33.1 | +31.0 | ||
| Turnout | 49,273 | 63.9 | −0.6 | ||
| Conservative hold | Swing | +15.0 | |||
| Party | Candidate | Votes | % | ±% | |
|---|---|---|---|---|---|
| Conservative | Ben Bradley | 23,392 | 46.6 | +18.4 | |
| Labour | Alan Meale | 22,335 | 44.5 | +5.1 | |
| UKIP | Sid Pepper | 2,654 | 5.3 | −19.8 | |
| Independent | Philip Shields | 1,079 | 2.2 | New | |
| Liberal Democrats | Anita Prabhakar | 697 | 1.4 | −1.9 | |
| Majority | 1,057 | 2.1 | N/A | ||
| Turnout | 50,157 | 64.5 | +3.6 | ||
| Conservative gain from Labour | Swing | +6.7 | |||
| Party | Candidate | Votes | % | ±% | |
|---|---|---|---|---|---|
| Labour | Alan Meale[17] | 18,603 | 39.4 | +0.7 | |
| Conservative | Andrea Clarke[18] | 13,288 | 28.2 | +1.9 | |
| UKIP | Sid Pepper[19] | 11,850 | 25.1 | +18.9 | |
| Liberal Democrats | Tony Rogers[20] | 1,642 | 3.5 | −11.9 | |
| Green | Paul Frost[21] | 1,486 | 3.1 | New | |
| TUSC | Karen Seymour[20] | 324 | 0.7 | New | |
| Majority | 5,315 | 11.2 | −1.2 | ||
| Turnout | 47,193 | 60.9 | +0.5 | ||
| Labour hold | Swing | −0.6 | |||
| Party | Candidate | Votes | % | ±% | |
|---|---|---|---|---|---|
| Labour | Alan Meale | 18,753 | 38.7 | −11.4 | |
| Conservative | Tracy Critchlow | 12,741 | 26.3 | +7.6 | |
| Liberal Democrats | Michael Wyatt[23] | 7,469 | 15.4 | +1.4 | |
| Mansfield Independent Forum | Andre Camilleri | 4,339 | 9.0 | −8.0 | |
| UKIP | David Hamilton | 2,985 | 6.2 | New | |
| BNP | Rachel Hill | 2,108 | 4.4 | New | |
| Majority | 6,012 | 12.4 | −19.0 | ||
| Turnout | 48,395 | 60.4 | +3.5 | ||
| Labour hold | Swing | −9.5 | |||
Elections in the 2000s
| Party | Candidate | Votes | % | ±% | |
|---|---|---|---|---|---|
| Labour | Alan Meale | 18,400 | 48.1 | −9.0 | |
| Conservative | Anne Wright | 7,035 | 18.4 | −8.8 | |
| Mansfield Independent Forum | Stewart Rickersey | 6,491 | 17.0 | New | |
| Liberal Democrats | Roger Shelley | 5,316 | 13.9 | −1.8 | |
| Veritas | Michael Harvey | 1,034 | 2.7 | New | |
| Majority | 11,365 | 29.7 | -0.2 | ||
| Turnout | 38,276 | 55.4 | +0.2 | ||
| Labour hold | Swing | −0.1 | |||
| Party | Candidate | Votes | % | ±% | |
|---|---|---|---|---|---|
| Labour | Alan Meale | 21,050 | 57.1 | -7.3 | |
| Conservative | William Wellesley | 10,012 | 27.2 | +6.0 | |
| Liberal Democrats | Tim Hill | 5,790 | 15.7 | +4.6 | |
| Majority | 11,038 | 29.9 | -13.4 | ||
| Turnout | 36,852 | 55.2 | -15.5 | ||
| Labour hold | Swing | ||||
Elections in the 1990s
| Party | Candidate | Votes | % | ±% | |
|---|---|---|---|---|---|
| Labour | Alan Meale | 30,556 | 64.4 | +10.0 | |
| Conservative | Tim Frost | 10,038 | 21.2 | −11.9 | |
| Liberal Democrats | Phil Smith | 5,244 | 11.1 | −1.5 | |
| Referendum | Jim Bogusz | 1,588 | 3.3 | New | |
| Majority | 20,518 | 43.3 | +22.0 | ||
| Turnout | 47,426 | 70.7 | -11.5 | ||
| Labour hold | Swing | ||||
| Party | Candidate | Votes | % | ±% | |
|---|---|---|---|---|---|
| Labour | Alan Meale | 29,932 | 54.4 | +16.9 | |
| Conservative | Gary S. Mond | 18,208 | 33.1 | −4.3 | |
| Liberal Democrats | Stuart R. Thompstone | 6,925 | 12.6 | −9.6 | |
| Majority | 11,724 | 21.3 | +21.2 | ||
| Turnout | 55,065 | 82.2 | +3.8 | ||
| Labour hold | Swing | +10.6 | |||
Elections in the 1980s
| Party | Candidate | Votes | % | ±% | |
|---|---|---|---|---|---|
| Labour | Alan Meale | 19,610 | 37.5 | −3.0 | |
| Conservative | Charles Hendry | 19,554 | 37.4 | +1.8 | |
| SDP | Barry Answer | 11,604 | 22.2 | −1.7 | |
| Moderate Labour | Brian Marshall | 1,580 | 3.0 | New | |
| Majority | 56 | 0.1 | -4.8 | ||
| Turnout | 52,348 | 78.4 | +7.7 | ||
| Labour hold | Swing | −2.4 | |||
| Party | Candidate | Votes | % | ±% | |
|---|---|---|---|---|---|
| Labour | Don Concannon | 18,670 | 40.5 | -11.8 | |
| Conservative | Richard Wrenn | 16,454 | 35.6 | +3.7 | |
| SDP | Stephen Taylor | 11,036 | 23.9 | New | |
| Majority | 2,216 | 4.9 | -15.5 | ||
| Turnout | 46,160 | 70.7 | -6.6 | ||
| Labour hold | Swing | -7.75 | |||
Elections in the 1970s
| Party | Candidate | Votes | % | ±% | |
|---|---|---|---|---|---|
| Labour | Don Concannon | 29,051 | 52.28 | -5.13 | |
| Conservative | K Daly | 17,720 | 31.89 | +8.73 | |
| Liberal | David Chambers | 8,536 | 15.36 | -3.19 | |
| National Front | P Donovan | 259 | 0.47 | New | |
| Majority | 11,331 | 20.39 | |||
| Turnout | 55,566 | 77.34 | |||
| Labour hold | Swing | -6.93 | |||
| Party | Candidate | Votes | % | ±% | |
|---|---|---|---|---|---|
| Labour | Don Concannon | 28,964 | 57.41 | ||
| Conservative | JR Wood | 11,685 | 23.16 | ||
| Liberal | David Chambers | 9,358 | 18.55 | ||
| Communist | Frederick Charles Westacott | 448 | 0.89 | ||
| Majority | 17,279 | 34.25 | |||
| Turnout | 50,455 | 72.54 | |||
| Labour hold | Swing | ||||
| Party | Candidate | Votes | % | ±% | |
|---|---|---|---|---|---|
| Labour | Don Concannon | 34,378 | 64.51 | ||
| Conservative | HJ Thompson | 18,236 | 34.22 | ||
| Communist | Frederick Charles Westacott | 675 | 1.27 | ||
| Majority | 16,142 | 30.29 | |||
| Turnout | 53,289 | 77.35 | |||
| Labour hold | Swing | ||||
| Party | Candidate | Votes | % | ±% | |
|---|---|---|---|---|---|
| Labour | Don Concannon | 30,554 | 66.12 | ||
| Conservative | C William H Morton | 15,027 | 32.52 | ||
| Communist | Frederick Charles Westacott | 628 | 1.36 | ||
| Majority | 15,527 | 33.60 | |||
| Turnout | 46,209 | 68.67 | |||
| Labour hold | Swing | ||||
Elections in the 1960s
| Party | Candidate | Votes | % | ±% | |
|---|---|---|---|---|---|
| Labour | Don Concannon | 28,849 | 64.24 | ||
| Conservative | Kenneth Clarke | 9,987 | 22.24 | ||
| Liberal | Reginald Strauther | 5,483 | 12.21 | ||
| Communist | Frederick Charles Westacott | 590 | 1.31 | New | |
| Majority | 18,862 | 42.00 | |||
| Turnout | 44,909 | 74.82 | |||
| Labour hold | Swing | ||||
| Party | Candidate | Votes | % | ±% | |
|---|---|---|---|---|---|
| Labour | Bernard Taylor | 29,055 | 63.57 | ||
| Conservative | Kenneth Clarke | 10,021 | 21.93 | ||
| Liberal | Reginald Strauther | 6,628 | 14.50 | ||
| Majority | 19,034 | 41.64 | |||
| Turnout | 45,704 | 77.86 | |||
| Labour hold | Swing | ||||
Elections in the 1950s
| Party | Candidate | Votes | % | ±% | |
|---|---|---|---|---|---|
| Labour | Bernard Taylor | 31,066 | 67.88 | ||
| Conservative | M Robert V Eliot | 14,700 | 32.12 | ||
| Majority | 16,366 | 35.76 | |||
| Turnout | 45,766 | 80.75 | |||
| Labour hold | Swing | ||||
| Party | Candidate | Votes | % | ±% | |
|---|---|---|---|---|---|
| Labour | Bernard Taylor | 29,543 | 68.46 | ||
| Conservative | Ian Berkeley Church | 13,610 | 31.54 | ||
| Majority | 15,933 | 36.92 | |||
| Turnout | 43,153 | 78.15 | |||
| Labour hold | Swing | ||||
| Party | Candidate | Votes | % | ±% | |
|---|---|---|---|---|---|
| Labour | Bernard Taylor | 37,097 | 69.92 | ||
| Conservative | Muriel Evelyn Williamson | 15,961 | 30.08 | ||
| Majority | 21,136 | 39.84 | |||
| Turnout | 53,058 | 83.34 | |||
| Labour hold | Swing | ||||
| Party | Candidate | Votes | % | ±% | |
|---|---|---|---|---|---|
| Labour | Bernard Taylor | 36,224 | 66.65 | ||
| Conservative | Herbert Leslie Milliard | 12,495 | 22.99 | ||
| Liberal | C H Preston Robinson | 5,145 | 9.47 | New | |
| Communist | W Les Ellis[31] | 482 | 0.89 | New | |
| Majority | 23,729 | 43.66 | |||
| Turnout | 54,346 | 85.83 | |||
| Labour hold | Swing | ||||
Elections in the 1940s
| Party | Candidate | Votes | % | ±% | |
|---|---|---|---|---|---|
| Labour | Bernard Taylor | 43,113 | 75.09 | ||
| Conservative | Thomas Lynch | 14,302 | 24.91 | ||
| Majority | 28,811 | 50.18 | |||
| Turnout | 57,415 | 75.93 | |||
| Labour hold | Swing | ||||
| Party | Candidate | Votes | % | ±% | |
|---|---|---|---|---|---|
| Labour | Bernard Taylor | Unopposed | N/A | N/A | |
| Labour hold | |||||
Elections in the 1930s
| Party | Candidate | Votes | % | ±% | |
|---|---|---|---|---|---|
| Labour | Charles Brown | 31,803 | 68.01 | ||
| Conservative | Alexander Spearman | 14,962 | 31.99 | ||
| Majority | 16,841 | 36.02 | |||
| Turnout | 46,765 | 69.54 | |||
| Labour hold | Swing | ||||
| Party | Candidate | Votes | % | ±% | |
|---|---|---|---|---|---|
| Labour | Charles Brown | 26,865 | 55.77 | ||
| Conservative | ESB Hopkin | 21,303 | 44.23 | ||
| Majority | 5,562 | 11.54 | |||
| Turnout | 48,168 | 77.01 | |||
| Labour hold | Swing | ||||
Elections in the 1920s
| Party | Candidate | Votes | % | ±% | |
|---|---|---|---|---|---|
| Labour | Charles Brown | 28,416 | 58.6 | −0.4 | |
| Liberal | William Collins | 10,517 | 21.7 | New | |
| Unionist | S R Sidebottom | 9,035 | 18.6 | −22.4 | |
| Communist | Rosina Smith | 533 | 1.1 | New | |
| Majority | 17,899 | 36.9 | +18.9 | ||
| Turnout | 48,501 | 81.2 | +6.4 | ||
| Registered electors | 59,735 | ||||
| Labour hold | Swing | +11.0 | |||
| Party | Candidate | Votes | % | ±% | |
|---|---|---|---|---|---|
| Labour | Frank Varley | 19,441 | 59.0 | +1.2 | |
| Unionist | C.L. Hanington | 13,535 | 41.0 | New | |
| Majority | 5,906 | 18.0 | +2.4 | ||
| Turnout | 32,976 | 74.8 | −1.1 | ||
| Registered electors | 44,094 | ||||
| Labour hold | Swing | +1.2 | |||
| Party | Candidate | Votes | % | ±% | |
|---|---|---|---|---|---|
| Labour | Frank Varley | 18,813 | 57.8 | +9.8 | |
| Liberal | Albert Bennett | 13,757 | 42.2 | −9.8 | |
| Majority | 5,056 | 15.6 | N/A | ||
| Turnout | 32,570 | 75.9 | +1.6 | ||
| Registered electors | 42,937 | ||||
| Labour gain from Liberal | Swing | +9.8 | |||
| Party | Candidate | Votes | % | ±% | |
|---|---|---|---|---|---|
| Liberal | Albert Bennett | 16,192 | 52.0 | +32.5 | |
| Labour | William Carter | 14,917 | 48.0 | +4.4 | |
| Majority | 1,275 | 4.0 | N/A | ||
| Turnout | 31,109 | 74.3 | +21.8 | ||
| Registered electors | 41,868 | ||||
| Liberal gain from Labour | Swing | +14.1 | |||
Elections in the 1910s
| Party | Candidate | Votes | % | ±% | |
|---|---|---|---|---|---|
| Labour | William Carter | 8,957 | 43.6 | New | |
| C | National Democratic | George Jarrett | 6,678 | 32.6 | New |
| Liberal | Violet Markham | 4,000 | 19.5 | −53.5 | |
| Independent | Nowroji Merwangi Tarachand | 878 | 4.3 | New | |
| Majority | 2,279 | 11.0 | N/A | ||
| Turnout | 20,513 | 52.5 | −21.4 | ||
| Registered electors | 39,041 | ||||
| Labour gain from Liberal | Swing | N/A | |||
| C indicates candidate endorsed by the coalition government. | |||||
Election results 1885–1918
Elections in the 1880s
| Party | Candidate | Votes | % | ±% | |
|---|---|---|---|---|---|
| Liberal | Cecil Foljambe | 6,120 | 72.6 | ||
| Conservative | John Horne Payne | 2,305 | 27.4 | ||
| Majority | 3,815 | 45.2 | |||
| Turnout | 8,425 | 85.4 | |||
| Registered electors | 9,862 | ||||
| Liberal win (new seat) | |||||
| Party | Candidate | Votes | % | ±% | |
|---|---|---|---|---|---|
| Liberal | Cecil Foljambe | 4,876 | 63.3 | -9.3 | |
| Conservative | Lancelot Rolleston | 2,832 | 36.7 | +9.3 | |
| Majority | 2,044 | 26.6 | -18.6 | ||
| Turnout | 7,708 | 78.2 | -7.2 | ||
| Registered electors | 9,862 | ||||
| Liberal hold | Swing | -9.3 | |||
Elections in the 1890s
| Party | Candidate | Votes | % | ±% | |
|---|---|---|---|---|---|
| Liberal | John Williams | 5,731 | 63.9 | +0.6 | |
| Conservative | Daniel Warde | 3,235 | 36.1 | -0.6 | |
| Majority | 2,496 | 27.8 | +1.2 | ||
| Turnout | 8,966 | 77.7 | -0.5 | ||
| Registered electors | 11,539 | ||||
| Liberal hold | Swing | +0.6 | |||
| Party | Candidate | Votes | % | ±% | |
|---|---|---|---|---|---|
| Liberal | John Williams | 5,670 | 57.0 | -6.9 | |
| Conservative | Henry Eyre | 4,285 | 43.0 | +6.9 | |
| Majority | 1,385 | 14.0 | -13.8 | ||
| Turnout | 9,955 | 80.6 | +2.9 | ||
| Registered electors | 12,345 | ||||
| Liberal hold | Swing | -6.9 | |||
Elections in the 1900s
| Party | Candidate | Votes | % | ±% | |
|---|---|---|---|---|---|
| Liberal | Arthur Markham | 6,496 | 61.2 | +4.2 | |
| Conservative | Henry Eyre | 4,127 | 38.8 | -4.2 | |
| Majority | 2,369 | 22.4 | +8.4 | ||
| Turnout | 10,623 | 73.5 | -7.1 | ||
| Registered electors | 14,456 | ||||
| Liberal hold | Swing | +4.2 | |||
| Party | Candidate | Votes | % | ±% | |
|---|---|---|---|---|---|
| Liberal | Arthur Markham | Unopposed | |||
| Liberal hold | |||||
Elections in the 1910s
| Party | Candidate | Votes | % | ±% | |
|---|---|---|---|---|---|
| Liberal | Arthur Markham | 12,622 | 74.2 | N/A | |
| Conservative | John George Drummond Campbell | 4,382 | 25.8 | New | |
| Majority | 8,240 | 48.4 | N/A | ||
| Turnout | 17,004 | 80.7 | N/A | ||
| Liberal hold | Swing | ||||
| Party | Candidate | Votes | % | ±% | |
|---|---|---|---|---|---|
| Liberal | Arthur Markham | 11,383 | 73.0 | -1.2 | |
| Conservative | Frederick Pepys Cockerill | 4,200 | 27.0 | +1.2 | |
| Majority | 7,183 | 46.0 | -2.4 | ||
| Turnout | 15,583 | 73.9 | -6.8 | ||
| Liberal hold | Swing | -1.2 | |||
General Election 1914–15:
Another General Election was required to take place before the end of 1915. The political parties had been making preparations for an election to take place and by July 1914, the following candidates had been selected;
- Liberal: Arthur Markham
- Unionist:
- Labour:
| Party | Candidate | Votes | % | ±% | |
|---|---|---|---|---|---|
| Liberal | Charles Seely | 7,597 | 63.0 | -10.0 | |
| Independent | Arthur Turnbull* | 4,456 | 37.0 | New | |
| Majority | 3,141 | 26.0 | -20.0 | ||
| Turnout | 12,053 | 48.7 | -25.2 | ||
| Liberal hold | Swing | ||||
- supported by Horatio Bottomley
See also
Notes
- ↑ A county constituency (for the purposes of election expenses and type of returning officer)
- ↑ As with all constituencies, the constituency elects one Member of Parliament (MP) by the first past the post system of election at least every five years.
References
- ↑ "Electorate Figures – Boundary Commission for England". 2011 Electorate Figures. Boundary Commission for England. 4 March 2011. Archived from the original on 6 November 2010. Retrieved 13 March 2011.
- ↑ "Chap. 23. Redistribution of Seats Act, 1885". The Public General Acts of the United Kingdom passed in the forty-eighth and forty-ninth years of the reign of Queen Victoria. London: Eyre and Spottiswoode. 1885. pp. 111–198.
- ↑ Fraser, Hugh (1918). The Representation of the People Act, 1918: with explanatory notes. London: Sweet and Maxwell.
- ↑ "Representation of the People Act 1948: Schedule 1", legislation.gov.uk, The National Archives, 1948 c. 65 (sch. 1), retrieved 23 July 2023
- ↑ "The Parliamentary Constituencies (Nottinghamshire) Order 1955. SI 1955/169". Statutory Instruments 1955. Part II. London: Her Majesty's Stationery Office. 1956. pp. 2157–2159.
- ↑ "The Parliamentary Constituencies (England) Order 1983", legislation.gov.uk, The National Archives, SI 1983/417, retrieved 23 July 2023
- ↑ "The Parliamentary Constituencies (England) Order 2007", legislation.gov.uk, The National Archives, SI 2007/1681, retrieved 23 July 2023
- ↑ 2010 post-revision map non-metropolitan areas and unitary authorities of England Archived 3 October 2013 at the Wayback Machine
- ↑ "Mansfield - LGBCE". www.lgbce.org.uk. Archived from the original on 24 December 2013. Retrieved 31 January 2013.
- ↑ "The Parliamentary Constituencies Order 2023". Schedule I Part I.
- ↑ "Mansfield MP Sir Alan Meale officially knighted by Prince Charles". Chad. 19 January 2012. Retrieved 11 May 2013.
- ↑ Leigh Rayment's Historical List of MPs – Constituencies beginning with "M" (part 1)
- ↑ "Mansfield MP wants to 'see the job through' by getting re-elected at next general election". Mansfield and Ashfield Chad. Retrieved 24 December 2023.
- ↑ "Former Mansfield mayoral candidate to stand for Labour at next general election". Mansfield and Ashfield Chad. Retrieved 24 December 2023.
- ↑ "Mansfield Parliamentary constituency". BBC News. BBC. Retrieved 21 November 2019.
- ↑ "Election Data 2015". Electoral Calculus. Archived from the original on 17 October 2015. Retrieved 17 October 2015.
- ↑ "MANSFIELD 2015". electionresults.blogspot.co.uk.
- ↑ Mansfield and Ashfield Conservatives, Selection of a Parliamentary candidates [sic] Archived 16 December 2014 at the Wayback Machine 12 December 2014, Retrieved 16 December 2014
- ↑ UKIP up for fight against Labour in Mansfield Archived 12 February 2015 at the Wayback Machine Nottingham Post 7 February 2015 Retrieved 11 February 2015
- 1 2 Mansfield District Council Statement of Persons Nominated and Notice of Poll Retrieved 10 April 2015
- ↑ Green Party.org Retrieved 16 December 2014
- ↑ "Election Data 2010". Electoral Calculus. Archived from the original on 26 July 2013. Retrieved 17 October 2015.
- ↑ "Michael Wyatt". Liberal Democrats. Retrieved 5 April 2010.
- ↑ "Election Data 2005". Electoral Calculus. Archived from the original on 15 October 2011. Retrieved 18 October 2015.
- ↑ "Election Data 2001". Electoral Calculus. Archived from the original on 15 October 2011. Retrieved 18 October 2015.
- ↑ "Election Data 1997". Electoral Calculus. Archived from the original on 15 October 2011. Retrieved 18 October 2015.
- ↑ "Election Data 1992". Electoral Calculus. Archived from the original on 15 October 2011. Retrieved 18 October 2015.
- ↑ "Politics Resources". Election 1992. Politics Resources. 9 April 1992. Archived from the original on 24 July 2011. Retrieved 6 December 2010.
- ↑ "Election Data 1987". Electoral Calculus. Archived from the original on 15 October 2011. Retrieved 18 October 2015.
- ↑ "Election Data 1983". Electoral Calculus. Archived from the original on 15 October 2011. Retrieved 18 October 2015.
- ↑ Walker, Michael. "Ellis Les". Graham Stevenson. Retrieved 29 April 2017.
- 1 2 3 4 5 6 7 8 9 10 11 12 13 British Parliamentary Election Results 1918–1949, FWS Craig
- ↑ British Parliamentary Election Results 1885–1918, FWS Craig
- 1 2 3 4 5 6 The Liberal Year Book, 1907
- ↑ Debrett's House of Commons & Judicial Bench, 1886
- 1 2 Debrett's House of Commons & Judicial Bench, 1901
- 1 2 3 Debrett's House of Commons & Judicial Bench, 1916