A signal-flow graph or signal-flowgraph (SFG), invented by Claude Shannon,[1] but often called a Mason graph after Samuel Jefferson Mason who coined the term,[2] is a specialized flow graph, a directed graph in which nodes represent system variables, and branches (edges, arcs, or arrows) represent functional connections between pairs of nodes. Thus, signal-flow graph theory builds on that of directed graphs (also called digraphs), which includes as well that of oriented graphs. This mathematical theory of digraphs exists, of course, quite apart from its applications.[3][4]
SFGs are most commonly used to represent signal flow in a physical system and its controller(s), forming a cyber-physical system. Among their other uses are the representation of signal flow in various electronic networks and amplifiers, digital filters, state-variable filters and some other types of analog filters. In nearly all literature, a signal-flow graph is associated with a set of linear equations.
History
Wai-Kai Chen wrote: "The concept of a signal-flow graph was originally worked out by Shannon [1942][1] in dealing with analog computers. The greatest credit for the formulation of signal-flow graphs is normally extended to Mason [1953],[2] [1956].[5] He showed how to use the signal-flow graph technique to solve some difficult electronic problems in a relatively simple manner. The term signal flow graph was used because of its original application to electronic problems and the association with electronic signals and flowcharts of the systems under study."[6]
Lorens wrote: "Previous to Mason's work, C. E. Shannon[1] worked out a number of the properties of what are now known as flow graphs. Unfortunately, the paper originally had a restricted classification and very few people had access to the material."[7]
"The rules for the evaluation of the graph determinant of a Mason Graph were first given and proven by Shannon [1942] using mathematical induction. His work remained essentially unknown even after Mason published his classical work in 1953. Three years later, Mason [1956] rediscovered the rules and proved them by considering the value of a determinant and how it changes as variables are added to the graph. [...]"[8]
Domain of application
Robichaud et al. identify the domain of application of SFGs as follows:[9]
- "All the physical systems analogous to these networks [constructed of ideal transformers, active elements and gyrators] constitute the domain of application of the techniques developed [here]. Trent[10] has shown that all the physical systems which satisfy the following conditions fall into this category.
- The finite lumped system is composed of a number of simple parts, each of which has known dynamical properties which can be defined by equations using two types of scalar variables and parameters of the system. Variables of the first type represent quantities which can be measured, at least conceptually, by attaching an indicating instrument to two connection points of the element. Variables of the second type characterize quantities which can be measured by connecting a meter in series with the element. Relative velocities and positions, pressure differentials and voltages are typical quantities of the first class, whereas electric currents, forces, rates of heat flow, are variables of the second type. Firestone has been the first to distinguish these two types of variables with the names across variables and through variables.
- Variables of the first type must obey a mesh law, analogous to Kirchhoff's voltage law, whereas variables of the second type must satisfy an incidence law analogous to Kirchhoff's current law.
- Physical dimensions of appropriate products of the variables of the two types must be consistent. For the systems in which these conditions are satisfied, it is possible to draw a linear graph isomorphic with the dynamical properties of the system as described by the chosen variables. The techniques [...] can be applied directly to these linear graphs as well as to electrical networks, to obtain a signal flow graph of the system."
Basic flow graph concepts
The following illustration and its meaning were introduced by Mason to illustrate basic concepts:[2]

In the simple flow graphs of the figure, a functional dependence of a node is indicated by an incoming arrow, the node originating this influence is the beginning of this arrow, and in its most general form the signal flow graph indicates by incoming arrows only those nodes that influence the processing at the receiving node, and at each node, i, the incoming variables are processed according to a function associated with that node, say Fi. The flowgraph in (a) represents a set of explicit relationships:
Node x1 is an isolated node because no arrow is incoming; the equations for x2 and x3 have the graphs shown in parts (b) and (c) of the figure.
These relationships define for every node a function that processes the input signals it receives. Each non-source node combines the input signals in some manner, and broadcasts a resulting signal along each outgoing branch. "A flow graph, as defined originally by Mason, implies a set of functional relations, linear or not."[9]
However, the commonly used Mason graph is more restricted, assuming that each node simply sums its incoming arrows, and that each branch involves only the initiating node involved. Thus, in this more restrictive approach, the node x1 is unaffected while:
and now the functions fij can be associated with the signal-flow branches ij joining the pair of nodes xi, xj, rather than having general relationships associated with each node. A contribution by a node to itself like f33 for x3 is called a self-loop. Frequently these functions are simply multiplicative factors (often called transmittances or gains), for example, fij(xj)=cijxj, where c is a scalar, but possibly a function of some parameter like the Laplace transform variable s. Signal-flow graphs are very often used with Laplace-transformed signals, because then they represent systems of Linear differential equations. In this case the transmittance, c(s), often is called a transfer function.
Choosing the variables
In general, there are several ways of choosing the variables in a complex system. Corresponding to each choice, a system of equations can be written and each system of equations can be represented in a graph. This formulation of the equations becomes direct and automatic if one has at his disposal techniques which permit the drawing of a graph directly from the schematic diagram of the system under study. The structure of the graphs thus obtained is related in a simple manner to the topology of the schematic diagram, and it becomes unnecessary to consider the equations, even implicitly, to obtain the graph. In some cases, one has simply to imagine the flow graph in the schematic diagram and the desired answers can be obtained without even drawing the flow graph.
— Robichaud[11]
Non-uniqueness
Robichaud et al. wrote: "The signal flow graph contains the same information as the equations from which it is derived; but there does not exist a one-to-one correspondence between the graph and the system of equations. One system will give different graphs according to the order in which the equations are used to define the variable written on the left-hand side."[9] If all equations relate all dependent variables, then there are n! possible SFGs to choose from.[12]
Linear signal-flow graphs
Linear signal-flow graph (SFG) methods only apply to linear time-invariant systems, as studied by their associated theory. When modeling a system of interest, the first step is often to determine the equations representing the system's operation without assigning causes and effects (this is called acausal modeling).[13] A SFG is then derived from this system of equations.
A linear SFG consists of nodes indicated by dots and weighted directional branches indicated by arrows. The nodes are the variables of the equations and the branch weights are the coefficients. Signals may only traverse a branch in the direction indicated by its arrow. The elements of a SFG can only represent the operations of multiplication by a coefficient and addition, which are sufficient to represent the constrained equations. When a signal traverses a branch in its indicated direction, the signal is multiplied the weight of the branch. When two or more branches direct into the same node, their outputs are added.
For systems described by linear algebraic or differential equations, the signal-flow graph is mathematically equivalent to the system of equations describing the system, and the equations governing the nodes are discovered for each node by summing incoming branches to that node. These incoming branches convey the contributions of the other nodes, expressed as the connected node value multiplied by the weight of the connecting branch, usually a real number or function of some parameter (for example a Laplace transform variable s).
For linear active networks, Choma writes:[14] "By a 'signal flow representation' [or 'graph', as it is commonly referred to] we mean a diagram that, by displaying the algebraic relationships among relevant branch variables of network, paints an unambiguous picture of the way an applied input signal ‘flows’ from input-to-output ... ports."
A motivation for a SFG analysis is described by Chen:[15]
- "The analysis of a linear system reduces ultimately to the solution of a system of linear algebraic equations. As an alternative to conventional algebraic methods of solving the system, it is possible to obtain a solution by considering the properties of certain directed graphs associated with the system." [See subsection: Solving linear equations.] "The unknowns of the equations correspond to the nodes of the graph, while the linear relations between them appear in the form of directed edges connecting the nodes. ...The associated directed graphs in many cases can be set up directly by inspection of the physical system without the necessity of first formulating the →associated equations..."
Basic components
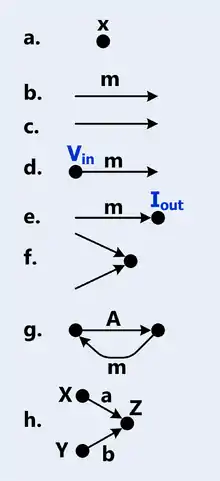
A linear signal flow graph is related to a system of linear equations[16] of the following form:
-
- where = transmittance (or gain) from to .
The figure to the right depicts various elements and constructs of a signal flow graph (SFG).[17]
- Exhibit (a) is a node. In this case, the node is labeled . A node is a vertex representing a variable or signal.
- A source node has only outgoing branches (represents an independent variable). As a special case, an input node is characterized by having one or more attached arrows pointing away from the node and no arrows pointing into the node. Any open, complete SFG will have at least one input node.
- An output or sink node has only incoming branches (represents a dependent variable). Although any node can be an output, explicit output nodes are often used to provide clarity. Explicit output nodes are characterized by having one or more attached arrows pointing into the node and no arrows pointing away from the node. Explicit output nodes are not required.
- A mixed node has both incoming and outgoing branches.
- Exhibit (b) is a branch with a multiplicative gain of . The meaning is that the output, at the tip of the arrow, is times the input at the tail of the arrow. The gain can be a simple constant or a function (for example: a function of some transform variable such as , , or , for Laplace, Fourier or Z-transform relationships).
- Exhibit (c) is a branch with a multiplicative gain of one. When the gain is omitted, it is assumed to be unity.
- Exhibit (d) is an input node. In this case, is multiplied by the gain .
- Exhibit (e) is an explicit output node; the incoming edge has a gain of .
- Exhibit (f) depicts addition. When two or more arrows point into a node, the signals carried by the edges are added.
- Exhibit (g) depicts a simple loop. The loop gain is .
- Exhibit (h) depicts the expression .
Terms used in linear SFG theory also include:[17]
- Path. A path is a continuous set of branches traversed in the direction indicated by the branch arrows.
- Open path. If no node is re-visited, the path is open.
- Forward path. A path from an input node (source) to an output node (sink) that does not re-visit any node.
- Path gain: the product of the gains of all the branches in the path.
- Loop. A closed path. (it originates and ends on the same node, and no node is touched more than once).
- Loop gain: the product of the gains of all the branches in the loop.
- Non-touching loops. Non-touching loops have no common nodes.
- Graph reduction. Removal of one or more nodes from a graph using graph transformations.
- Residual node. In any contemplated process of graph reduction, the nodes to be retained in the new graph are called residual nodes.[2]
- Splitting a node. Splitting a node corresponds to splitting a node into two half nodes, one being a sink and the other a source.[18]
- Index: The index of a graph is the minimum number of nodes which have to be split in order to remove all the loops in a graph.
- Index node. The nodes that are split to determine the index of a graph are called index nodes, and in general they are not unique.
Systematic reduction to sources and sinks
A signal-flow graph may be simplified by graph transformation rules.[19][20][21] These simplification rules are also referred to as signal-flow graph algebra.[22] The purpose of this reduction is to relate the dependent variables of interest (residual nodes, sinks) to its independent variables (sources).
The systematic reduction of a linear signal-flow graph is a graphical method equivalent to the Gauss-Jordan elimination method for solving linear equations.[23]
The rules presented below may be applied over and over until the signal flow graph is reduced to its "minimal residual form". Further reduction can require loop elimination or the use of a "reduction formula" with the goal to directly connect sink nodes representing the dependent variables to the source nodes representing the independent variables. By these means, any signal-flow graph can be simplified by successively removing internal nodes until only the input and output and index nodes remain.[24][25] Robichaud described this process of systematic flow-graph reduction:
The reduction of a graph proceeds by the elimination of certain nodes to obtain a residual graph showing only the variables of interest. This elimination of nodes is called "node absorption". This method is close to the familiar process of successive eliminations of undesired variables in a system of equations. One can eliminate a variable by removing the corresponding node in the graph. If one reduces the graph sufficiently, it is possible to obtain the solution for any variable and this is the objective which will be kept in mind in this description of the different methods of reduction of the graph. In practice, however, the techniques of reduction will be used solely to transform the graph to a residual graph expressing some fundamental relationships. Complete solutions will be more easily obtained by application of Mason's rule.[26] The graph itself programs the reduction process. Indeed a simple inspection of the graph readily suggests the different steps of the reduction which are carried out by elementary transformations, by loop elimination, or by the use of a reduction formula.[26]
— Robichaud, Signal flow graphs and applications, 1962
For digitally reducing a flow graph using an algorithm, Robichaud extends the notion of a simple flow graph to a generalized flow graph:
Before describing the process of reduction...the correspondence between the graph and a system of linear equations ... must be generalized...The generalized graphs will represent some operational relationships between groups of variables...To each branch of the generalized graph is associated a matrix giving the relationships between the variables represented by the nodes at the extremities of that branch...[27] The elementary transformations [defined by Robichaud in his Figure 7.2, p. 184] and the loop reduction permit the elimination of any node j of the graph by the reduction formula:[described in Robichaud's Equation 7-1]. With the reduction formula, it is always possible to reduce a graph of any order... [After reduction] the final graph will be a cascade graph in which the variables of the sink nodes are explicitly expressed as functions of the sources. This is the only method for reducing the generalized graph since Mason's rule is obviously inapplicable.[28]
— Robichaud, Signal flow graphs and applications, 1962
The definition of an elementary transformation varies from author to author:
- Some authors only consider as elementary transformations the summation of parallel-edge gains and the multiplication of series-edge gains, but not the elimination of self-loops[23][29]
- Other authors consider the elimination of a self-loop as an elementary transformation[30]
Parallel edges. Replace parallel edges with a single edge having a gain equal to the sum of original gains.
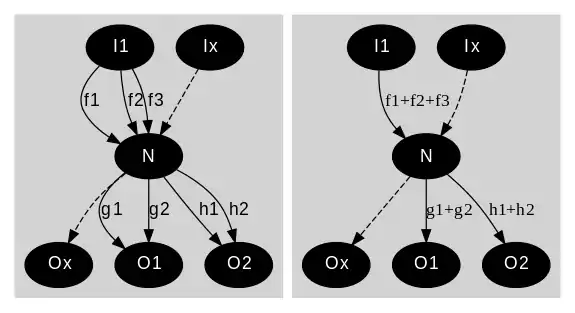
The graph on the left has parallel edges between nodes. On the right, these parallel edges have been replaced with a single edge having a gain equal to the sum of the gains on each original edge.
The equations corresponding to the reduction between N and node I1 are:
Outflowing edges. Replace outflowing edges with edges directly flowing from the node's sources.

The graph on the left has an intermediate node N between nodes from which it has inflows, and nodes to which it flows out. The graph on the right shows direct flows between these node sets, without transiting via N.
For the sake of simplicity, N and its inflows are not represented. The outflows from N are eliminated.
The equations corresponding to the reduction directly relating N's input signals to its output signals are:
Zero-signal nodes.
Eliminate outflowing edges from a node determined to have a value of zero.

If the value of a node is zero, its outflowing edges can be eliminated.
Nodes without outflows.
Eliminate a node without outflows.
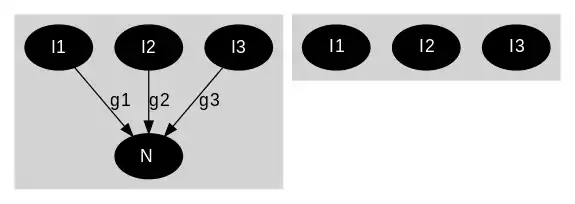
In this case, N is not a variable of interest, and it has no outgoing edges; therefore, N, and its inflowing edges, can be eliminated.
Self-looping edge. Replace looping edges by adjusting the gains on the incoming edges.
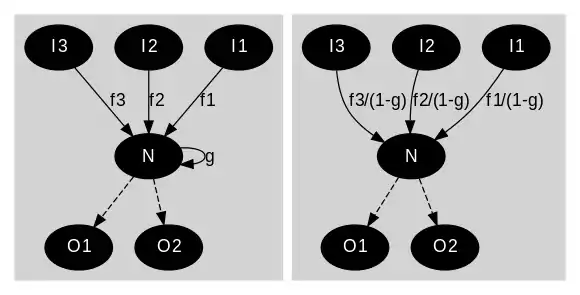
The graph on the left has a looping edge at node N, with a gain of g. On the right, the looping edge has been eliminated, and all inflowing edges have their gain divided by (1-g).
The equations corresponding to the reduction between N and all its input signals are:
Implementations
The above procedure for building the SFG from an acausal system of equations and for solving the SFG's gains have been implemented[31] as an add-on to MATHLAB 68,[32] an on-line system providing machine aid for the mechanical symbolic processes encountered in analysis.
Solving linear equations
Signal flow graphs can be used to solve sets of simultaneous linear equations.[33] The set of equations must be consistent and all equations must be linearly independent.
Putting the equations in "standard form"
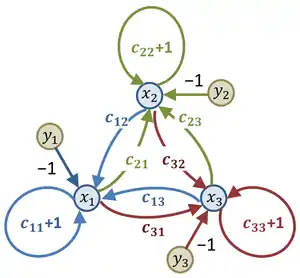
For M equations with N unknowns where each yj is a known value and each xj is an unknown value, there is equation for each known of the following form.
- ; the usual form for simultaneous linear equations with 1 ≤ j ≤ M
Although it is feasible, particularly for simple cases, to establish a signal flow graph using the equations in this form, some rearrangement allows a general procedure that works easily for any set of equations, as now is presented. To proceed, first the equations are rewritten as
and further rewritten as
and finally rewritten as
- ; form suitable to be expressed as a signal flow graph.
- where δkj = Kronecker delta
The signal-flow graph is now arranged by selecting one of these equations and addressing the node on the right-hand side. This is the node for which the node connects to itself with the branch of weight including a '+1', making a self-loop in the flow graph. The other terms in that equation connect this node first to the source in this equation and then to all the other branches incident on this node. Every equation is treated this way, and then each incident branch is joined to its respective emanating node. For example, the case of three variables is shown in the figure, and the first equation is:
where the right side of this equation is the sum of the weighted arrows incident on node x1.
As there is a basic symmetry in the treatment of every node, a simple starting point is an arrangement of nodes with each node at one vertex of a regular polygon. When expressed using the general coefficients {cin}, the environment of each node is then just like all the rest apart from a permutation of indices. Such an implementation for a set of three simultaneous equations is seen in the figure.[34]
Often the known values, yj are taken as the primary causes and the unknowns values, xj to be effects, but regardless of this interpretation, the last form for the set of equations can be represented as a signal-flow graph. This point is discussed further in the subsection Interpreting 'causality'.
Applying Mason's gain formula
In the most general case, the values for all the xk variables can be calculated by computing Mason's gain formula for the path from each yj to each xk and using superposition.
- where Gkj = the sum of Mason's gain formula computed for all the paths from input yj to variable xk.
In general, there are N-1 paths from yj to variable xk so the computational effort to calculated Gkj is proportional to N-1. Since there are M values of yj, Gkj must be computed M times for a single value of xk. The computational effort to calculate a single xk variable is proportional to (N-1)(M). The effort to compute all the xk variables is proportional to (N)(N-1)(M). If there are N equations and N unknowns, then the computation effort is on the order of N3.
Relation to block diagrams
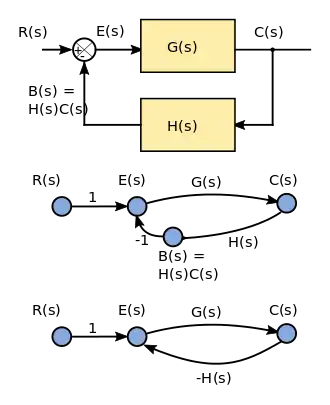
For some authors, a linear signal-flow graph is more constrained than a block diagram,[35] in that the SFG rigorously describes linear algebraic equations represented by a directed graph.
For other authors, linear block diagrams and linear signal-flow graphs are equivalent ways of depicting a system, and either can be used to solve the gain.[36]
A tabulation of the comparison between block diagrams and signal-flow graphs is provided by Bakshi & Bakshi,[37] and another tabulation by Kumar.[38] According to Barker et al.:[39]
- "The signal flow graph is the most convenient method for representing a dynamic system. The topology of the graph is compact and the rules for manipulating it are easier to program than the corresponding rules that apply to block diagrams."
In the figure, a simple block diagram for a feedback system is shown with two possible interpretations as a signal-flow graph. The input R(s) is the Laplace-transformed input signal; it is shown as a source node in the signal-flow graph (a source node has no input edges). The output signal C(s) is the Laplace-transformed output variable. It is represented as a sink node in the flow diagram (a sink has no output edges). G(s) and H(s) are transfer functions, with H(s) serving to feed back a modified version of the output to the input, B(s). The two flow graph representations are equivalent.
Interpreting 'causality'
The term "cause and effect" was applied by Mason to SFGs:[2]
- "The process of constructing a graph is one of tracing a succession of cause and effects through the physical system. One variable is expressed as an explicit effect due to certain causes; they in turn, are recognized as effects due to still other causes."
- — S.J. Mason: Section IV: Illustrative applications of flow graph technique
and has been repeated by many later authors:[40]
- "The signal flow graph is another visual tool for representing causal relationships between components of the system. It is a simplified version of a block diagram introduced by S.J. Mason as a cause-and-effect representation of linear systems."
- — Arthur G.O. Mutambara: Design and Analysis of Control Systems, p.238
However, Mason's paper is concerned to show in great detail how a set of equations is connected to an SFG, an emphasis unrelated to intuitive notions of "cause and effect". Intuitions can be helpful for arriving at an SFG or for gaining insight from an SFG, but are inessential to the SFG. The essential connection of the SFG is to its own set of equations, as described, for example, by Ogata:[41]
- "A signal-flow graph is a diagram that represents a set of simultaneous algebraic equations. When applying the signal flow graph method to analysis of control systems, we must first transform linear differential equations into algebraic equations in [the Laplace transform variable] s.."
- — Katsuhiko Ogata: Modern Control Engineering, p. 104
There is no reference to "cause and effect" here, and as said by Barutsky:[42]
- "Like block diagrams, signal flow graphs represent the computational, not the physical structure of a system."
- — Wolfgang Borutzky, Bond Graph Methodology, p. 10
The term "cause and effect" may be misinterpreted as it applies to the SFG, and taken incorrectly to suggest a system view of causality,[43] rather than a computationally based meaning. To keep discussion clear, it may be advisable to use the term "computational causality", as is suggested for bond graphs:[44]
- "Bond-graph literature uses the term computational causality, indicating the order of calculation in a simulation, in order to avoid any interpretation in the sense of intuitive causality."
The term "computational causality" is explained using the example of current and voltage in a resistor:[45]
- "The computational causality of physical laws can therefore not be predetermined, but depends upon the particular use of that law. We cannot conclude whether it is the current flowing through a resistor that causes a voltage drop, or whether it is the difference in potentials at the two ends of the resistor that cause current to flow. Physically these are simply two concurrent aspects of one and the same physical phenomenon. Computationally, we may have to assume at times one position, and at other times the other."
- — François Cellier & Ernesto Kofman: §1.5 Simulation software today and tomorrow, p. 15
A computer program or algorithm can be arranged to solve a set of equations using various strategies. They differ in how they prioritize finding some of the variables in terms of the others, and these algorithmic decisions, which are simply about solution strategy, then set up the variables expressed as dependent variables earlier in the solution to be "effects", determined by the remaining variables that now are "causes", in the sense of "computational causality".
Using this terminology, it is computational causality, not system causality, that is relevant to the SFG. There exists a wide-ranging philosophical debate, not concerned specifically with the SFG, over connections between computational causality and system causality.[46]
Signal-flow graphs for analysis and design
Signal-flow graphs can be used for analysis, that is for understanding a model of an existing system, or for synthesis, that is for determining the properties of a design alternative.
Signal-flow graphs for dynamic systems analysis
When building a model of a dynamic system, a list of steps is provided by Dorf & Bishop:[47]
- Define the system and its components.
- Formulate the mathematical model and list the needed assumptions.
- Write the differential equations describing the model.
- Solve the equations for the desired output variables.
- Examine the solutions and the assumptions.
- If needed, reanalyze or redesign the system.
- —RC Dorf and RH Bishop, Modern Control Systems, Chapter 2, p. 2
In this workflow, equations of the physical system's mathematical model are used to derive the signal-flow graph equations.
Signal-flow graphs for design synthesis
Signal-flow graphs have been used in Design Space Exploration (DSE), as an intermediate representation towards a physical implementation. The DSE process seeks a suitable solution among different alternatives. In contrast with the typical analysis workflow, where a system of interest is first modeled with the physical equations of its components, the specification for synthesizing a design could be a desired transfer function. For example, different strategies would create different signal-flow graphs, from which implementations are derived.[48] Another example uses an annotated SFG as an expression of the continuous-time behavior, as input to an architecture generator[49]
Shannon and Shannon-Happ formulas
Shannon's formula is an analytic expression for calculating the gain of an interconnected set of amplifiers in an analog computer. During World War II, while investigating the functional operation of an analog computer, Claude Shannon developed his formula. Because of wartime restrictions, Shannon's work was not published at that time, and, in 1952, Mason rediscovered the same formula.
William W. Happ generalized the Shannon formula for topologically closed systems.[50] The Shannon-Happ formula can be used for deriving transfer functions, sensitivities, and error functions.[51]
For a consistent set of linear unilateral relations, the Shannon-Happ formula expresses the solution using direct substitution (non-iterative).[51][52]
NASA's electrical circuit software NASAP is based on the Shannon-Happ formula.[51][52]
Linear signal-flow graph examples
Simple voltage amplifier

The amplification of a signal V1 by an amplifier with gain a12 is described mathematically by
This relationship represented by the signal-flow graph of Figure 1. is that V2 is dependent on V1 but it implies no dependency of V1 on V2. See Kou page 57.[53]
Ideal negative feedback amplifier
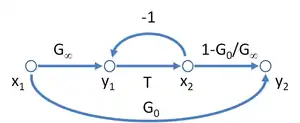

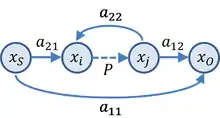
A possible SFG for the asymptotic gain model for a negative feedback amplifier is shown in Figure 3, and leads to the equation for the gain of this amplifier as
The interpretation of the parameters is as follows: T = return ratio, G∞ = direct amplifier gain, G0 = feedforward (indicating the possible bilateral nature of the feedback, possibly deliberate as in the case of feedforward compensation). Figure 3 has the interesting aspect that it resembles Figure 2 for the two-port network with the addition of the extra feedback relation x2 = T y1.
From this gain expression an interpretation of the parameters G0 and G∞ is evident, namely:
There are many possible SFG's associated with any particular gain relation. Figure 4 shows another SFG for the asymptotic gain model that can be easier to interpret in terms of a circuit. In this graph, parameter β is interpreted as a feedback factor and A as a "control parameter", possibly related to a dependent source in the circuit. Using this graph, the gain is
To connect to the asymptotic gain model, parameters A and β cannot be arbitrary circuit parameters, but must relate to the return ratio T by:
and to the asymptotic gain as:
Substituting these results into the gain expression,
which is the formula of the asymptotic gain model.
Electrical circuit containing a two-port network

The figure to the right depicts a circuit that contains a y-parameter two-port network. Vin is the input of the circuit and V2 is the output. The two-port equations impose a set of linear constraints between its port voltages and currents. The terminal equations impose other constraints. All these constraints are represented in the SFG (Signal Flow Graph) below the circuit. There is only one path from input to output which is shown in a different color and has a (voltage) gain of -RLy21. There are also three loops: -Riny11, -RLy22, Riny21RLy12. Sometimes a loop indicates intentional feedback but it can also indicate a constraint on the relationship of two variables. For example, the equation that describes a resistor says that the ratio of the voltage across the resistor to the current through the resistor is a constant which is called the resistance. This can be interpreted as the voltage is the input and the current is the output, or the current is the input and the voltage is the output, or merely that the voltage and current have a linear relationship. Virtually all passive two terminal devices in a circuit will show up in the SFG as a loop.
The SFG and the schematic depict the same circuit, but the schematic also suggests the circuit's purpose. Compared to the schematic, the SFG is awkward but it does have the advantage that the input to output gain can be written down by inspection using Mason's rule.
Mechatronics : Position servo with multi-loop feedback
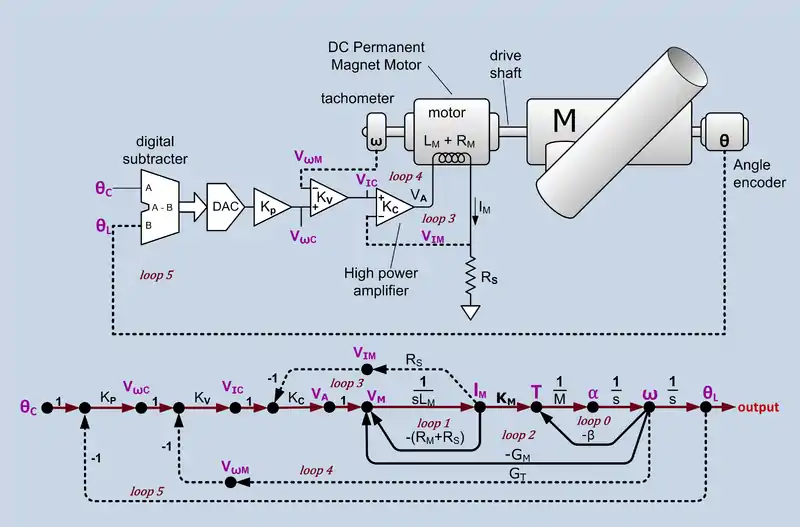
This example is representative of a SFG (signal-flow graph) used to represent a servo control system and illustrates several features of SFGs. Some of the loops (loop 3, loop 4 and loop 5) are extrinsic intentionally designed feedback loops. These are shown with dotted lines. There are also intrinsic loops (loop 0, loop1, loop2) that are not intentional feedback loops, although they can be analyzed as though they were. These loops are shown with solid lines. Loop 3 and loop 4 are also known as minor loops because they are inside a larger loop.
- The forward path begins with θC, the desired position command. This is multiplied by KP which could be a constant or a function of frequency. KP incorporates the conversion gain of the DAC and any filtering on the DAC output. The output of KP is the velocity command VωC which is multiplied by KV which can be a constant or a function of frequency. The output of KV is the current command, VIC which is multiplied by KC which can be a constant or a function of frequency. The output of KC is the amplifier output voltage, VA. The current, IM, though the motor winding is the integral of the voltage applied to the inductance. The motor produces a torque, T, proportional to IM. Permanent magnet motors tend to have a linear current to torque function. The conversion constant of current to torque is KM. The torque, T, divided by the load moment of inertia, M, is the acceleration, α, which is integrated to give the load velocity ω which is integrated to produce the load position, θLC.
- The forward path of loop 0 asserts that acceleration is proportional to torque and the velocity is the time integral of acceleration. The backward path says that as the speed increases there is a friction or drag that counteracts the torque. Torque on the load decreases proportionately to the load velocity until the point is reached that all the torque is used to overcome friction and the acceleration drops to zero. Loop 0 is intrinsic.
- Loop1 represents the interaction of an inductor's current with its internal and external series resistance. The current through an inductance is the time integral of the voltage across the inductance. When a voltage is first applied, all of it appears across the inductor. This is shown by the forward path through . As the current increases, voltage is dropped across the inductor internal resistance RM and the external resistance RS. This reduces the voltage across the inductor and is represented by the feedback path -(RM + RS). The current continues to increase but at a steadily decreasing rate until the current reaches the point at which all the voltage is dropped across (RM + RS). Loop 1 is intrinsic.
- Loop2 expresses the effect of the motor back EMF. Whenever a permanent magnet motor rotates, it acts like a generator and produces a voltage in its windings. It does not matter whether the rotation is caused by a torque applied to the drive shaft or by current applied to the windings. This voltage is referred to as back EMF. The conversion gain of rotational velocity to back EMF is GM. The polarity of the back EMF is such that it diminishes the voltage across the winding inductance. Loop 2 is intrinsic.
- Loop 3 is extrinsic. The current in the motor winding passes through a sense resister. The voltage, VIM, developed across the sense resister is fed back to the negative terminal of the power amplifier KC. This feedback causes the voltage amplifier to act like a voltage controlled current source. Since the motor torque is proportional to motor current, the sub-system VIC to the output torque acts like a voltage controlled torque source. This sub-system may be referred to as the "current loop" or "torque loop". Loop 3 effectively diminishes the effects of loop 1 and loop 2.
- Loop 4 is extrinsic. A tachometer (actually a low power dc generator) produces an output voltage VωM that is proportional to is angular velocity. This voltage is fed to the negative input of KV. This feedback causes the sub-system from VωC to the load angular velocity to act like a voltage to velocity source. This sub-system may be referred to as the "velocity loop". Loop 4 effectively diminishes the effects of loop 0 and loop 3.
- Loop 5 is extrinsic. This is the overall position feedback loop. The feedback comes from an angle encoder that produces a digital output. The output position is subtracted from the desired position by digital hardware which drives a DAC which drives KP. In the SFG, the conversion gain of the DAC is incorporated into KP.
See Mason's rule for development of Mason's Gain Formula for this example.
Terminology and classification of signal-flow graphs
There is some confusion in literature about what a signal-flow graph is; Henry Paynter, inventor of bond graphs, writes: "But much of the decline of signal-flow graphs [...] is due in part to the mistaken notion that the branches must be linear and the nodes must be summative. Neither assumption was embraced by Mason, himself !"[55]
Standards covering signal-flow graphs
- IEEE Std 155-1960, IEEE Standards on Circuits: Definitions of Terms for Linear Signal Flow Graphs, 1960.
- This IEEE standard defines a signal-flow graph as a network of directed branches representing dependent and independent signals as nodes. Incoming branches carry branch signals to the dependent node signals. A dependent node signal is the algebraic sum of the incoming branch signals at that node, i.e. nodes are summative.
State transition signal-flow graph
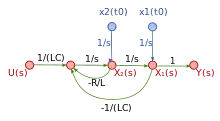
A state transition SFG or state diagram is a simulation diagram for a system of equations, including the initial conditions of the states.[56]
Closed flowgraph
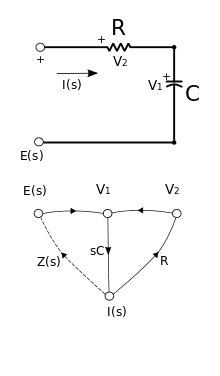
Closed flowgraphs describe closed systems and have been utilized to provide a rigorous theoretical basis for topological techniques of circuit analysis.[50]
- Terminology for closed flowgraph theory includes:
- Contributive node. Summing point for two or more incoming signals resulting in only one outgoing signal.
- Distributive node. Sampling point for two or more outgoing signals resulting from only one incoming signal.
- Compound node. Contraction of a contributive node and a distributive node.
- Strictly dependent & strictly independent node. A strictly independent node represent s an independent source; a strictly dependent node represents a meter.
- Open & Closed Flowgraphs. An open flowgraph contains strictly dependent or strictly independent nodes; otherwise it is a closed flowgraph.
Nonlinear flow graphs
Mason introduced both nonlinear and linear flow graphs. To clarify this point, Mason wrote : "A linear flow graph is one whose associated equations are linear."[2]
Examples of nonlinear branch functions
It we denote by xj the signal at node j, the following are examples of node functions that do not pertain to a linear time-invariant system:
Examples of nonlinear signal-flow graph models
- Although they generally can't be transformed between time domain and frequency domain representations for classical control theory analysis, nonlinear signal-flow graphs can be found in electrical engineering literature.[57][58]
- Nonlinear signal-flow graphs can also be found in life sciences, for example, Dr Arthur Guyton's model of the cardiovascular system.[59]
Applications of SFG techniques in various fields of science
- Electronic circuits
- Characterizing sequential circuits of the Moore and Mealy type, obtaining regular expressions from state diagrams.[60]
- Synthesis of non-linear data converters[58]
- Control and network theory
- Stochastic signal processing.[61]
- Reliability of electronic systems[62]
- Physiology and biophysics
- Cardiac output regulation[63]
- Simulation
- Simulation on analog computers[64]
- Neuroscience and Combinatorics
See also
- Asymptotic gain model
- Bond graphs
- Coates graph
- Control Systems/Signal Flow Diagrams in the Control Systems Wikibook
- Flow graph (mathematics)
- Leapfrog filter for an example of filter design using a signal flow graph
- Mason's gain formula
- Minor loop feedback
- Noncommutative signal-flow graph
Notes
- 1 2 3
CE Shannon (January 1942). "The theory and design of linear differential equation machines". Fire Control of the US National Defense Research Committee: Report 411, Section D-2.
{{cite journal}}: Cite journal requires|journal=(help) Reprinted in N. J. A. Sloane; Aaron D. Wyner, eds. (1993). Claude E. Shannon: Collected Papers. Wiley IEEE Press. p. 514. ISBN 978-0-7803-0434-5. - 1 2 3 4 5 6
Mason, Samuel J. (September 1953). "Feedback Theory - Some Properties of Signal Flow Graphs" (PDF). Proceedings of the IRE. 41 (9): 1144–1156. doi:10.1109/jrproc.1953.274449. S2CID 17565263.
The flow graph may be interpreted as a signal transmission system in which each node is a tiny repeater station. The station receives signals via the incoming branches, combines the information in some manner, and then transmits the results along each outgoing branch.
- ↑ Jørgen Bang-Jensen; Gregory Z. Gutin (2008). Digraphs. Springer. ISBN 9781848009981.
- ↑ Bela Bollobas (1998). Modern graph theory. Springer Science & Business Media. p. 8. ISBN 9781461206194.i
- ↑ SJ Mason (July 1956). "Feedback Theory-Further Properties of Signal Flow Graphs". Proceedings of the IRE. 44 (7): 920–926. doi:10.1109/JRPROC.1956.275147. hdl:1721.1/4778. S2CID 18184015. On-line version found at MIT Research Laboratory of Electronics.
- ↑ Chen, Wai-Kai (1976). Applied Graph Theory : Graphs and Electrical Networks. Elsevier. ISBN 9781483164151.(WKC 1976, p. 167)
- ↑ Lorens, Charles Stanton (July 15, 1956), Vogel, Dan (ed.), Technical Report 317 - Theory and applications of flow graphs (PDF), Research Laboratory of Electronics, MIT
- ↑ (WKC 1976, p. 169)
- 1 2 3 Louis PA Robichaud; Maurice Boisvert; Jean Robert (1962). "Preface". Signal flow graphs and applications. Prentice-Hall electrical engineering series. Prentice Hall. p. x. ASIN B0000CLM1G.
- ↑ Horace M Trent (1955). "Isomorphisms between Oriented Linear Graphs and Lumped Physical Systems". Journal of the Acoustical Society of America. 27 (3): 500–527. Bibcode:1955ASAJ...27..500T. doi:10.1121/1.1907949.
- ↑ (Robichaud 1962, p. ix)
- ↑ Narsingh Deo (2004). Graph Theory with Applications to Engineering and Computer Science. PHI Learning Pvt. Ltd. p. 418. ISBN 9788120301450.
- ↑ Kofránek, J; Mateják, M; Privitzer, P; Tribula, M (2008), Causal or acausal modeling: labour for humans or labour for machines (PDF), Technical Computing Prague 2008. Conference Proceedings., Prague, p. 16, archived from the original (PDF) on 2009-12-29
{{citation}}: CS1 maint: location missing publisher (link) - ↑ J Choma, Jr (April 1990). "Signal flow analysis of feedback networks". IEEE Transactions on Circuits and Systems. 37 (4): 455–463. Bibcode:1990ITCS...37..455C. doi:10.1109/31.52748.
- ↑ Wai-Kai Chen (1971). "Chapter 3: Directed graph solutions of linear algebraic equations". Applied graph theory. North-Holland Pub. Co. p. 140. ISBN 978-0444101051. Partly accessible using Amazon's look-inside feature.
- ↑ See, for example, Katsuhiko Ogata (2004). "Chapter 3-9: Signal flow graph representation of linear systems". Modern Control Engineering (4th ed.). Prentice Hall. pp. 106 ff. ISBN 978-0130609076. However, there is not a one-to-one correspondence: Narsingh Deo (2004). Graph Theory with Applications to Engineering and Computer Science. PHI Learning Pvt. Ltd. p. 418. ISBN 9788120301450.
- 1 2 Kuo, Benjamin C. (1967). Automatic Control Systems (2nd ed.). Prentice-Hall. pp. 59–60.
- ↑ Louis PA Robichaud; Maurice Boisvert; Jean Robert (1962). "§1-4: Definitions and terminology". Signal flow graphs and applications. Prentice-Hall electrical engineering series. Prentice Hall. p. 8. ASIN B0000CLM1G.
- ↑ J. R. Abrahams; G. P. Coverley (2014). "Chapter 2: Operations with a flow graph". Signal Flow Analysis: The Commonwealth and International Library. Elsevier. pp. 21 ff. ISBN 9781483180700.
- ↑ Isaac M. Horowitz (2013). "Reduction of signal-flow graphs". Synthesis of Feedback Systems. Elsevier. pp. 18 ff. ISBN 9781483267708.
- ↑ (Ogata 2002, pp. 68, 106)
- ↑ (Ogata 2002, pp. 105, 106)
- 1 2 (Henley 1973, p. 12)
- ↑ (Phang 2001, p. 37)
- ↑ Examples of the signal-flow graph reduction can be found in (Robichaud 1962, p. 186, Sec. 7-3 Algebraic reduction of signal flow graphs)
- 1 2 (Robichaud 1962, pp. 9–10, Sec. 1–5: Reduction of the flow graph)
- ↑ (Robichaud 1962, pp. 182, 183 Sec. 7-1, 7-2 of Chapter 7: Algebraic reduction of signal flow graphs using a digital computer)
- ↑ (Robichaud 1962, p. 185, Sec. 7-2: Generalization of flow graphs)
- ↑ (Robichaud 1962, pp. 9, Sec. 1–5 REDUCTION OF THE FLOW GRAPH)
- ↑ Fakhfakh, Mourad; Tlelo-Cuautle, Esteban; V. Fernández, Francisco (2012). "Section 4.1.2 Signal flow graphs algebra". In Fakhfakh (ed.). Design of Analog Circuits Through Symbolic Analysis. Bentham Science Publishers. p. 418. ISBN 978-1-60805-425-1.
- ↑ Labrèche P., presentation: Linear Electrical Circuits:Symbolic Network Analysis, 1977.
- ↑ Carl Engelman, The legacy of MATHLAB 68, published in Proceeding SYMSAC '71 Proceedings of the second ACM symposium on Symbolic and algebraic manipulation, pages 29-41
- ↑ "... solving a set of simultaneous, linear algebraic equations. This problem, usually solved by matrix methods, can also be solved via graph theory. " Deo, Narsingh (1974). Graph Theory with Applications to Engineering and Computer Science. Prentice-Hall of India. p. 416. ISBN 978-81-203-0145-0. also on-line at
- ↑ Deo, Narsingh (1974). Graph Theory with Applications to Engineering and Computer Science. Prentice-Hall of India. p. 417. ISBN 978-81-203-0145-0. also on-line at
- ↑ "A signal flow graph may be regarded as a simplified version of a block diagram. ... for cause and effect ... of linear systems ...we may regard the signal-flow graphs to be constrained by more rigid mathematical rules, whereas the usage of the block-diagram notation is less stringent." Kuo, Benjamin C. (1991). Automatic Control Systems (6th ed.). Prentice-Hall. p. 77. ISBN 978-0-13-051046-4.
- ↑ Gene F. Franklin; et al. (Apr 29, 2014). "Appendix W.3 Block Diagram Reduction". Feedback Control of Dynamic Systems. Prentice Hall.
- ↑ V.U.Bakshi U.A.Bakshi (2007). "Table 5.6: Comparison of block diagram and signal flow graph methods". Control Engineering. Technical Publications. p. 120. ISBN 9788184312935.
- ↑ A Anand Kumar (2014). "Table: Comparison of block diagram and signal flow methods". Control Systems (2nd ed.). PHI Learning Pvt. Ltd. p. 165. ISBN 9788120349391.
- ↑ HA Barker; M Chen; P. Townsend (2014). "Algorithms for transformations between block diagrams and digital flow graphs". Computer Aided Design in Control Systems 1988: Selected Papers from the 4th IFAC Symposium, Beijing, PRC, 23-25, August 1988. Elsevier. pp. 281 ff. ISBN 9781483298795.
- ↑ For example, see Arthur G.O. Mutambara (1999). Design and Analysis of Control Systems. CRC Press. p. 238. ISBN 9780849318986.
- ↑ Katsuhiko Ogata (1997). "Signal flow graphs". Modern Control Engineering (4th ed.). Prentice Hall. p. 104. ISBN 978-0130432452.
- ↑ Wolfgang Borutzky (2009). Bond Graph Methodology: Development and Analysis of Multidisciplinary Dynamic System Models. Springer Science & Business Media. p. 10. ISBN 9781848828827.
- ↑ James J. Callahan (2000). "Causality: Definition 2.10". The Geometry of Spacetime: An Introduction to Special and General Relativity. Springer Science & Business Media. p. 76. ISBN 9780387986418.
- ↑ John JH Miller; Robert Vichnevetsky (July 22–26, 1991). John JH Miller; Robert Vichnevetsky (eds.). IMACS '91, Proceedings of the 13th IMACS World Congress on Computation and Applied Mathematics: July 22-26, 1991, Trinity College, Dublin, Ireland. International Association for Mathematics and Computers in Simulation.
- ↑ François E. Cellier; Ernesto Kofman (2006). Continuous System Simulation. Springer Science & Business Media. p. 15. ISBN 9780387261027.
- ↑ See, for example, Stephan Lewandowsky; Simon Farrell (2010). Computational Modeling in Cognition: Principles and Practice. SAGE Publications. ISBN 9781452236193.
- ↑ Dorf, Richard C.; Bishop, Robert H. (2001). "Chap 2.-1: Introduction" (PDF). Modern Control Systems. Prentice Hall. p. 2. ISBN 978-0-13-030660-9.
- ↑ Antao, B. A. A.; Brodersen, A.J. (June 1995). "ARCHGEN: Automated synthesis of analog systems". IEEE Transactions on Very Large Scale Integration (VLSI) Systems. 3 (2): 231–244. doi:10.1109/92.386223.
- ↑ Doboli, A.; Dhanwada, N.; Vemuri, R. (May 2000). "A heuristic technique for system-level architecture generation from signal-flow graph representations of analog systems". 2000 IEEE International Symposium on Circuits and Systems. Emerging Technologies for the 21st Century. Proceedings (IEEE Cat No.00CH36353). Circuits and Systems, 2000. Proceedings. ISCAS 2000 Geneva. The 2000 IEEE International Symposium on. Vol. 3. pp. 181–184. CiteSeerX 10.1.1.59.304. doi:10.1109/ISCAS.2000.856026. ISBN 978-0-7803-5482-1. S2CID 13948702.
- 1 2 3 Happ, William W. (1966). "Flowgraph Techniques for Closed Systems". IEEE Transactions on Aerospace and Electronic Systems. AES-2 (3): 252–264. Bibcode:1966ITAES...2..252H. doi:10.1109/TAES.1966.4501761. S2CID 51651723.
- 1 2 3 Potash, Hanan; McNamee, Lawrence P. (1968). "Application of unilateral and graph techniques to analysis of linear circuits: Solution by non-iterative methods". Proceedings, ACM National Conference: 367–378. doi:10.1145/800186.810601. S2CID 16623657.
- 1 2 Okrent, Howard; McNamee, Lawrence P. (1970). "3. 3 Flowgraph Theory" (PDF). NASAP-70 User's and Programmer's manual. Los Angeles, California: School of Engineering and Applied Science, University of California at Los Angeles. pp. 3–9.
- ↑ Kou (1967, p. 57)
- ↑
Arnaldo D’Amico, Christian Falconi, Gianluca Giustolisi, Gaetano Palumbo (April 2007). "Resistance of Feedback Amplifiers: A novel representation" (PDF). IEEE Transactions on Circuits and Systems – II Express Briefs. 54 (4): 298–302. CiteSeerX 10.1.1.694.8450. doi:10.1109/tcsii.2006.889713. S2CID 10154732.
{{cite journal}}: CS1 maint: multiple names: authors list (link) - ↑ Paynter, Henry (1992). "An Epistemic Prehistory of Bond Graphs" (PDF): 10, 15 pages.
{{cite journal}}: Cite journal requires|journal=(help) - ↑ Houpis, Constantine H.; Sheldon, Stuart N. (2013). "section 8.8". Linear Control System Analysis and Design with MATLAB®, Sixth Edition. Boca Raton, FL: CRC press. pp. 171–172. ISBN 9781466504264.
- ↑ For example: Baran, Thomas A.; Oppenhiem, Alan V. (2011), "Inversion of nonlinear and time-varying systems", 2011 Digital Signal Processing and Signal Processing Education Meeting (DSP/SPE), Digital Signal Processing Workshop and IEEE Signal Processing Education Workshop (DSP/SPE), IEEE, pp. 283–288, CiteSeerX 10.1.1.695.7460, doi:10.1109/DSP-SPE.2011.5739226, ISBN 978-1-61284-226-4, S2CID 5758954
- 1 2 Guilherme, J.; Horta, N. C.; Franca, J. E. (1999). SYMBOLIC SYNTHESIS OF NON-LINEAR DATA CONVERTERS (PDF).
- ↑ Hall, John E. (2004-11-01). "The pioneering use of systems analysis to study cardiac output regulation". American Journal of Physiology. Regulatory, Integrative and Comparative Physiology. 287 (5): R1009–R1011. doi:10.1152/classicessays.00007.2004. ISSN 0363-6119. PMID 15475497.
Figure 2, Arthur Guyton's computer model of the cardiovascular system, download jpeg
{{cite journal}}: External link in|quote= - ↑ BRZOZOWSKI, J.A.; McCLUSKEY, E. J. (1963). Signal Flow Graph Techniques for Sequential Circuit State Diagrams. IEEE Transactions on Electronic Computers. IEEE. p. 97.
- ↑
Barry, J. R., Lee, E. A., & Messerschmitt, D. G. (2004). Digital communication (Third ed.). New York: Springer. p. 86. ISBN 978-0-7923-7548-7.
{{cite book}}: CS1 maint: multiple names: authors list (link) - ↑ Happ, William W. (1964). Goldberg, M. F. (ed.). "Application of flowgraph techniques to the solution of reliability problems". Physics of Failure in Electronics (AD434/329): 375–423. doi:10.1109/IRPS.1963.362257.
- ↑ Hall, John E. (August 23, 2004). "The pioneering use of systems analysis to study cardiac output regulation". Am J Physiol Regul Integr Comp Physiol. 287 (5): R1009–R1011. doi:10.1152/classicessays.00007.2004. PMID 15475497.
- ↑ (Robichaud 1962, chapter 5 Direct Simulation on Analog Computers Through Signal Flow Graphs)
- ↑ Izhikevich, Eugene M (Feb 2006). "Polychronization: computation with spikes". Neural Computation. 18 (2): 245–282. doi:10.1162/089976606775093882. PMID 16378515. S2CID 14253998.
- ↑ Dolores-Cuenca, E.& Arciniega-Nevárez, J.A.& Nguyen, A.& Zou, A.Y.& Van Popering, L.& Crock, N.& Erlebacher, G.& Mendoza-Cortes, J.L. (April 2023). "Polychrony as Chinampas". Algorithms. 16 (4): 193. arXiv:2103.15265. doi:10.3390/a16040193.
{{cite journal}}: CS1 maint: multiple names: authors list (link)
References
- Ernest J. Henley & R. A. Williams (1973). Graph theory in modern engineering; computer aided design, control, optimization, reliability analysis. Academic Press. ISBN 978-0-08-095607-7. Book almost entirely devoted to this topic.
- Kou, Benjamin C. (1967), Automatic Control Systems, Prentice Hall
- Robichaud, Louis P.A.; Maurice Boisvert; Jean Robert (1962). Signal flow graphs and applications. Prentice-Hall electrical engineering series. Englewood Cliffs, N.J.: Prentice Hall. pp. xiv, 214 p.
- Deo, Narsingh (1974), Graph Theory with Applications to Engineering and Computer Science, PHI Learning Pvt. Ltd., p. 418, ISBN 978-81-203-0145-0
- K Thulasiramen; MNS Swarmy (2011). "§6.11 The Coates and Mason graphs". Graphs: Theory and algorithms. John Wiley & Sons. pp. 163 ff. ISBN 9781118030257.
- Ogata, Katsuhiko (2002). "Section 3-9 Signal Flow Graphs". Modern Control Engineering 4th Edition. Prentice-Hal. ISBN 978-0-13-043245-2.
- Phang, Khoman (2000-12-14). "2.5 An overview of Signal-flow graphs" (PDF). CMOS Optical Preamplifier Design Using Graphical Circuit Analysis (Thesis). Department of Electrical and Computer Engineering, University of Toronto. © Copyright by Khoman Phang 2001
Further reading
- Wai-Kai Chen (1976). Applied Graph Theory. North Holland Publishing Company. ISBN 978-0720423624. Chapter 3 for the essentials, but applications are scattered throughout the book.
- Wai-Kai Chen (May 1964). "Some applications of linear graphs". Contract DA-28-043-AMC-00073 (E). Coordinated Science Laboratory, University of Illinois, Urbana. Archived from the original on January 10, 2015.
- K. Thulasiraman & M. N. S. Swamy (1992). Graphs: Theory and Algorithms. John Wiley & Sons. 6.10-6.11 for the essential mathematical idea. ISBN 978-0-471-51356-8.
- Shu-Park Chan (2006). "Graph theory". In Richard C. Dorf (ed.). Circuits, Signals, and Speech and Image Processing (3rd ed.). CRC Press. § 3.6. ISBN 978-1-4200-0308-6. Compares Mason and Coates graph approaches with Maxwell's k-tree approach.
- RF Hoskins (2014). "Flow-graph and signal flow-graph analysis of linear systems". In SR Deards (ed.). Recent Developments in Network Theory: Proceedings of the Symposium Held at the College of Aeronautics, Cranfield, September 1961. Elsevier. ISBN 9781483223568. A comparison of the utility of the Coates flow graph and the Mason flow graph.
External links
- M. L. Edwards: S-parameters, signal flow graphs, and other matrix representations All Rights Reserved
- H Schmid: Signal-Flow Graphs in 12 Short Lessons
 Control Systems/Signal Flow Diagrams at Wikibooks
 Media related to Signal flow graphs at Wikimedia Commons