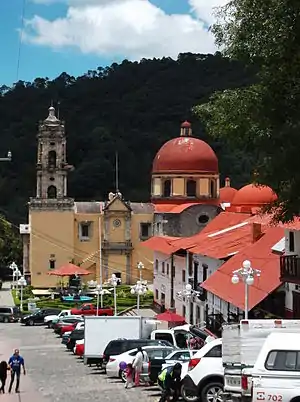
Mineral del Chico | |
|---|---|
Municipality and town | |
 | |
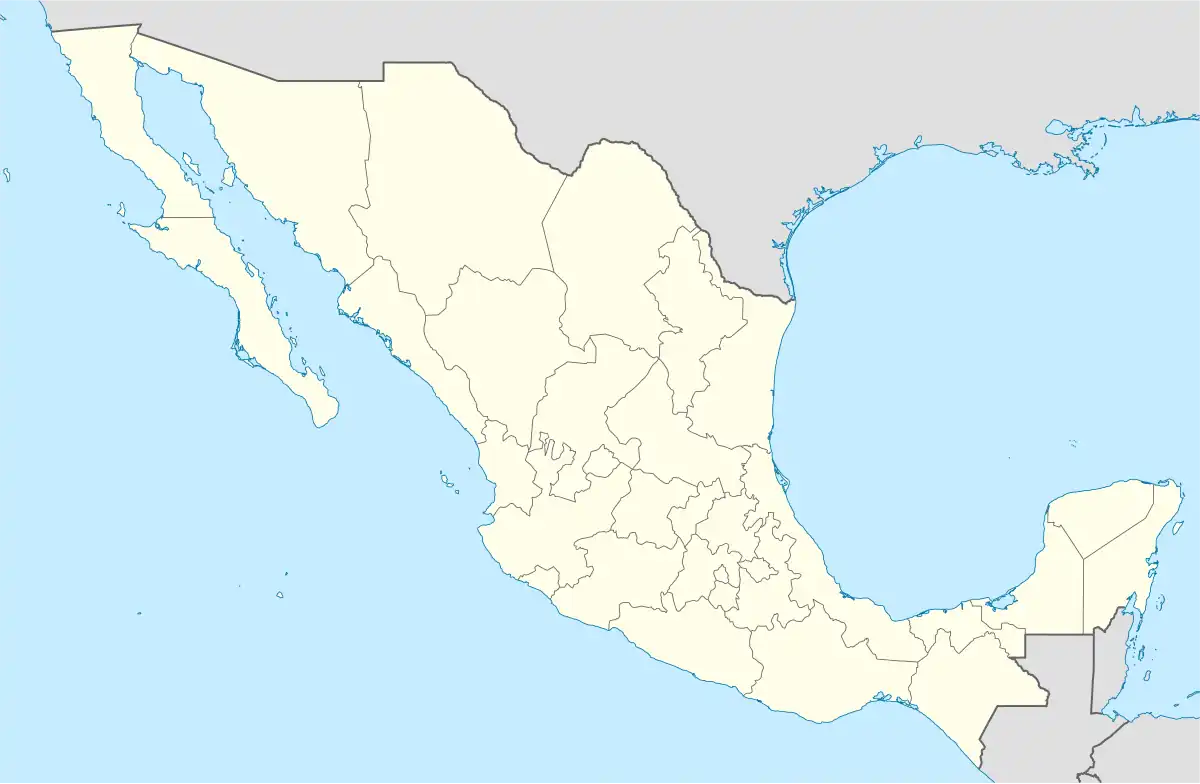
 Mineral del Chico Location in Mexico | |
| Coordinates: 20°12′11″N 98°44′52″W / 20.20306°N 98.74778°W | |
| Country | |
| State | Hidalgo |
| Municipal seat | Mineral del Chico |
| Area | |
| • Total | 118.2 km2 (45.6 sq mi) |
| Population (2010) | |
| • Total | 7,980 |
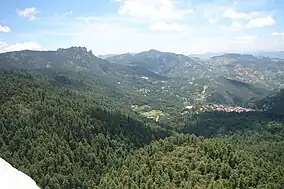
Mineral del Chico (Spanish: [mineˈɾal del ˈtʃiko] ⓘ) is a town and one of the 84 municipalities of Hidalgo, in central-eastern Mexico. The municipality covers an area of 118.2 km².
As of 2010, the municipality had a total population of 7,980.[1]
Geography
Climate
| Climate data for Mineral del Chico, Hidalgo, 1981-2010 normals, extremes 1980-present | |||||||||||||
|---|---|---|---|---|---|---|---|---|---|---|---|---|---|
| Month | Jan | Feb | Mar | Apr | May | Jun | Jul | Aug | Sep | Oct | Nov | Dec | Year |
| Record high °C (°F) | 29 (84) |
30 (86) |
30 (86) |
33 (91) |
34 (93) |
31 (88) |
29 (84) |
29 (84) |
26 (79) |
29 (84) |
26 (79) |
27 (81) |
34 (93) |
| Mean daily maximum °C (°F) | 19.5 (67.1) |
20.9 (69.6) |
23.1 (73.6) |
24.6 (76.3) |
24.4 (75.9) |
22.0 (71.6) |
20.5 (68.9) |
20.5 (68.9) |
19.5 (67.1) |
19.4 (66.9) |
19.6 (67.3) |
19.5 (67.1) |
21.1 (70.0) |
| Daily mean °C (°F) | 12.0 (53.6) |
13.1 (55.6) |
15.0 (59.0) |
16.6 (61.9) |
16.8 (62.2) |
15.7 (60.3) |
14.6 (58.3) |
14.6 (58.3) |
14.3 (57.7) |
13.5 (56.3) |
12.7 (54.9) |
12.2 (54.0) |
14.3 (57.7) |
| Mean daily minimum °C (°F) | 4.3 (39.7) |
5.1 (41.2) |
6.7 (44.1) |
8.2 (46.8) |
8.5 (47.3) |
9.1 (48.4) |
8.5 (47.3) |
8.0 (46.4) |
8.7 (47.7) |
7.4 (45.3) |
5.6 (42.1) |
4.8 (40.6) |
7.1 (44.7) |
| Record low °C (°F) | −6 (21) |
−6 (21) |
−5 (23) |
0 (32) |
0 (32) |
0 (32) |
0 (32) |
0 (32) |
0 (32) |
−2 (28) |
−5 (23) |
−6 (21) |
−6 (21) |
| Average precipitation mm (inches) | 18.4 (0.72) |
23.5 (0.93) |
16.0 (0.63) |
35.9 (1.41) |
63.8 (2.51) |
184.1 (7.25) |
197.2 (7.76) |
181.7 (7.15) |
251.6 (9.91) |
129.9 (5.11) |
32.3 (1.27) |
11.2 (0.44) |
1,145.6 (45.09) |
| Average rainy days (≥ 0.5 mm) | 3.1 | 3.5 | 3.4 | 6.0 | 7.7 | 14.3 | 17.7 | 15.4 | 18.1 | 11.6 | 4.8 | 2.4 | 108.0 |
| Source: Servicio Meteorológico Nacional[2][3] | |||||||||||||

Waterfall and chapel near Mineral del Chico
See also
References
- ↑ "Mineral del Chico". México en Cifras. Instituto Nacional de Estadística y Geografía . Retrieved July 24, 2014.
- ↑ "Normales 1981-2010". Servicio Meteorológico Nacional. Retrieved April 16, 2021.
- ↑ "Valores Extremos". Servicio Meteorológico Nacional. Retrieved April 16, 2021.
This article is issued from Wikipedia. The text is licensed under Creative Commons - Attribution - Sharealike. Additional terms may apply for the media files.

