Mondragon | |
|---|---|
| Municipality of Mondragon | |
 Flag | |
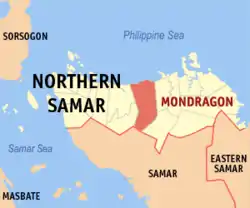 Map of Northern Samar with Mondragon highlighted | |
OpenStreetMap | |
.svg.png.webp) Mondragon Location within the Philippines | |
| Coordinates: 12°31′N 124°45′E / 12.52°N 124.75°E | |
| Country | Philippines |
| Region | Eastern Visayas |
| Province | Northern Samar |
| District | 1st district |
| Barangays | 24 (see Barangays) |
| Government | |
| • Type | Sangguniang Bayan |
| • Mayor | Mario M. Madera |
| • Vice Mayor | Dawn A. Unay |
| • Representative | Paul R. Daza |
| • Councilors | List |
| • Electorate | 29,120 voters (2022) |
| Area | |
| • Total | 288.90 km2 (111.54 sq mi) |
| Elevation | 18 m (59 ft) |
| Highest elevation | 150 m (490 ft) |
| Lowest elevation | 0 m (0 ft) |
| Population (2020 census)[3] | |
| • Total | 41,415 |
| • Density | 140/km2 (370/sq mi) |
| • Households | 8,582 |
| Economy | |
| • Income class | 3rd municipal income class |
| • Poverty incidence | 39.53 |
| • Revenue | ₱ 204.6 million (2020) |
| • Assets | ₱ 496.6 million (2020) |
| • Expenditure | ₱ 158.2 million (2020) |
| • Liabilities | ₱ 61.11 million (2020) |
| Service provider | |
| • Electricity | Northern Samar Electric Cooperative (NORSAMELCO) |
| Time zone | UTC+8 (PST) |
| ZIP code | 6417 |
| PSGC | |
| IDD : area code | +63 (0)55 |
| Native languages | Waray Tagalog |
Mondragon, officially the Municipality of Mondragon (Waray: Bungto han Mondragon; Tagalog: Bayan ng Mondragon), is a 3rd class municipality in the province of Northern Samar, Philippines. According to the 2020 census, it has a population of 41,415 people.[3]
Geography
Barangays
Mondragon is politically subdivided into 24 barangays. Each barangay consists of puroks and some have sitios.
Climate
| Climate data for Mondragon, Northern Samar | |||||||||||||
|---|---|---|---|---|---|---|---|---|---|---|---|---|---|
| Month | Jan | Feb | Mar | Apr | May | Jun | Jul | Aug | Sep | Oct | Nov | Dec | Year |
| Mean daily maximum °C (°F) | 27 (81) |
28 (82) |
29 (84) |
30 (86) |
31 (88) |
30 (86) |
29 (84) |
29 (84) |
29 (84) |
29 (84) |
29 (84) |
28 (82) |
29 (84) |
| Mean daily minimum °C (°F) | 22 (72) |
22 (72) |
22 (72) |
22 (72) |
24 (75) |
24 (75) |
24 (75) |
24 (75) |
24 (75) |
24 (75) |
23 (73) |
23 (73) |
23 (74) |
| Average precipitation mm (inches) | 84 (3.3) |
59 (2.3) |
58 (2.3) |
55 (2.2) |
93 (3.7) |
133 (5.2) |
149 (5.9) |
125 (4.9) |
155 (6.1) |
165 (6.5) |
140 (5.5) |
136 (5.4) |
1,352 (53.3) |
| Average rainy days | 18.1 | 13.6 | 15.8 | 16.1 | 21.7 | 25.5 | 26.6 | 25.1 | 24.8 | 25.8 | 22.7 | 20.1 | 255.9 |
| Source: Meteoblue[5] | |||||||||||||
Demographics
| Year | Pop. | ±% p.a. |
|---|---|---|
| 1903 | 2,713 | — |
| 1918 | 3,940 | +2.52% |
| 1939 | 7,369 | +3.03% |
| 1948 | 9,741 | +3.15% |
| 1960 | 12,302 | +1.96% |
| 1970 | 14,974 | +1.98% |
| 1975 | 15,834 | +1.13% |
| 1980 | 20,423 | +5.22% |
| 1990 | 21,399 | +0.47% |
| 1995 | 25,504 | +3.34% |
| 2000 | 28,098 | +2.10% |
| 2007 | 32,718 | +2.12% |
| 2010 | 35,318 | +2.82% |
| 2015 | 38,726 | +1.77% |
| 2020 | 41,415 | +1.33% |
| Source: Philippine Statistics Authority[6][7][8][9] | ||
Economy
References
- ↑ Municipality of Mondragon | (DILG)
- ↑ "2015 Census of Population, Report No. 3 – Population, Land Area, and Population Density" (PDF). Philippine Statistics Authority. Quezon City, Philippines. August 2016. ISSN 0117-1453. Archived (PDF) from the original on May 25, 2021. Retrieved July 16, 2021.
- 1 2 Census of Population (2020). "Region VIII (Eastern Visayas)". Total Population by Province, City, Municipality and Barangay. Philippine Statistics Authority. Retrieved 8 July 2021.
- ↑ "PSA Releases the 2018 Municipal and City Level Poverty Estimates". Philippine Statistics Authority. 15 December 2021. Retrieved 22 January 2022.
- ↑ "Mondragon, Northern Samar : Average Temperatures and Rainfall". Meteoblue. Retrieved 6 January 2019.
- ↑ Census of Population (2015). "Region VIII (Eastern Visayas)". Total Population by Province, City, Municipality and Barangay. Philippine Statistics Authority. Retrieved 20 June 2016.
- ↑ Census of Population and Housing (2010). "Region VIII (Eastern Visayas)" (PDF). Total Population by Province, City, Municipality and Barangay. National Statistics Office. Retrieved 29 June 2016.
- ↑ Censuses of Population (1903–2007). "Region VIII (Eastern Visayas)". Table 1. Population Enumerated in Various Censuses by Province/Highly Urbanized City: 1903 to 2007. National Statistics Office.
{{cite encyclopedia}}: CS1 maint: numeric names: authors list (link) - ↑ "Province of Northern Samar". Municipality Population Data. Local Water Utilities Administration Research Division. Retrieved 17 December 2016.
- ↑ "Poverty incidence (PI):". Philippine Statistics Authority. Retrieved December 28, 2020.
- ↑ "Estimation of Local Poverty in the Philippines" (PDF). Philippine Statistics Authority. 29 November 2005.
- ↑ "2003 City and Municipal Level Poverty Estimates" (PDF). Philippine Statistics Authority. 23 March 2009.
- ↑ "City and Municipal Level Poverty Estimates; 2006 and 2009" (PDF). Philippine Statistics Authority. 3 August 2012.
- ↑ "2012 Municipal and City Level Poverty Estimates" (PDF). Philippine Statistics Authority. 31 May 2016.
- ↑ "Municipal and City Level Small Area Poverty Estimates; 2009, 2012 and 2015". Philippine Statistics Authority. 10 July 2019.
- ↑ "PSA Releases the 2018 Municipal and City Level Poverty Estimates". Philippine Statistics Authority. 15 December 2021. Retrieved 22 January 2022.
External links
- Philippine Standard Geographic Code
- Philippine Census Information
- Local Governance Performance Management System
Places adjacent to Mondragon, Northern Samar | |
|---|---|
Catarman (capital and largest municipality) | |
| Municipalities | |
This article is issued from Wikipedia. The text is licensed under Creative Commons - Attribution - Sharealike. Additional terms may apply for the media files.