Moris | |
|---|---|
Town | |
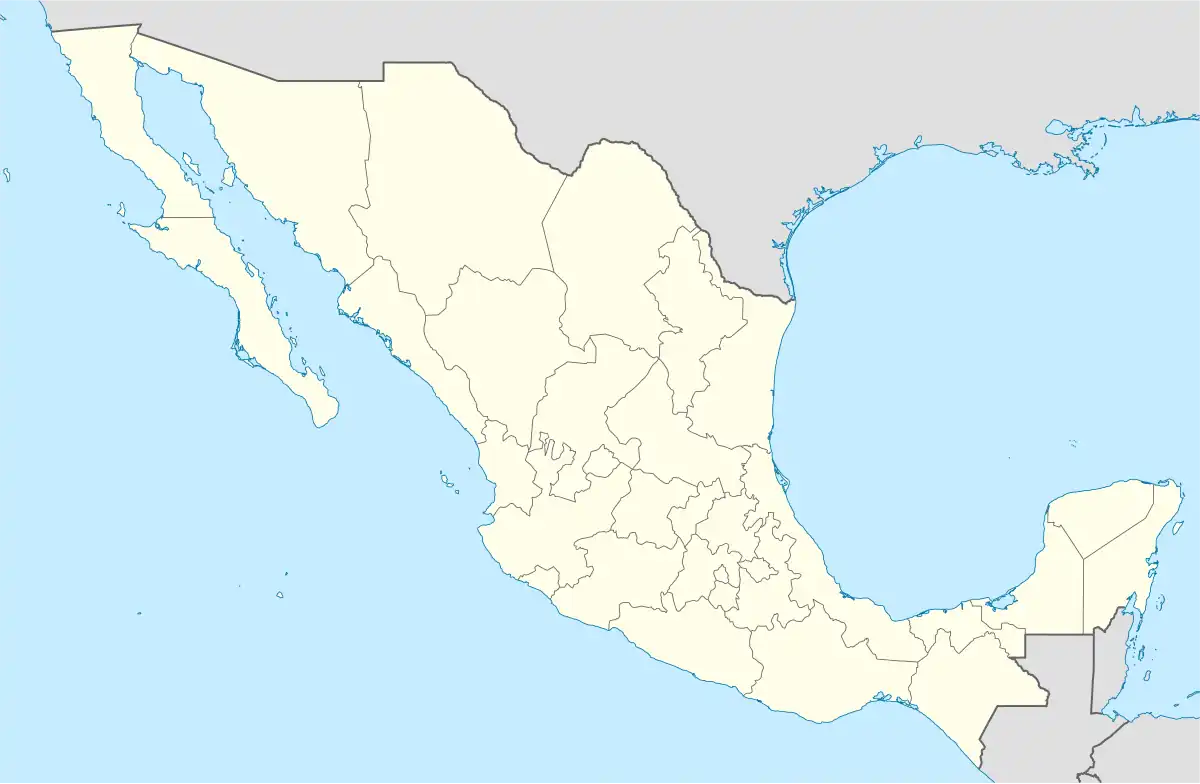 Moris Location in Mexico 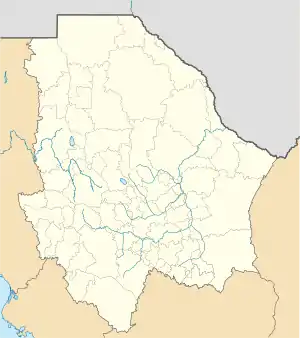 Moris Moris (Chihuahua) | |
| Coordinates: 28°8′57″N 108°31′10″W / 28.14917°N 108.51944°W | |
| Country | |
| State | Chihuahua |
| Municipality | Moris |
| Elevation | 757 m (2,484 ft) |
| Population (2010) | |
| • Total | 1,799 |
Moris is a town and seat of Moris Municipality, in the northern Mexican state of Chihuahua. As of 2010, the town of Moris had a population of 1,799,[1] up from 1,158 as of 2005.[2]
Geography
Climate
Moris has a Mediterranean climate (Köppen Csa), with hot summers and mild winters, often presenting freezing temperatures. The highest temperature ever recorded in Moris is 51.5 °C (125 °F), recorded in June 2014, and a low temperature of −7.0 °C (19 °F) was recorded in January 1977.
| Climate data for Moris, Chihuahua (1981–2010, extremes (1972-present) | |||||||||||||
|---|---|---|---|---|---|---|---|---|---|---|---|---|---|
| Month | Jan | Feb | Mar | Apr | May | Jun | Jul | Aug | Sep | Oct | Nov | Dec | Year |
| Record high °C (°F) | 32.0 (89.6) |
37.0 (98.6) |
39.0 (102.2) |
45.0 (113.0) |
45.0 (113.0) |
51.5 (124.7) |
44.0 (111.2) |
43.0 (109.4) |
42.0 (107.6) |
39.0 (102.2) |
36.0 (96.8) |
38.0 (100.4) |
51.5 (124.7) |
| Mean daily maximum °C (°F) | 24.4 (75.9) |
26.1 (79.0) |
28.9 (84.0) |
32.4 (90.3) |
36.3 (97.3) |
38.2 (100.8) |
35.1 (95.2) |
34.4 (93.9) |
34.0 (93.2) |
31.1 (88.0) |
27.9 (82.2) |
24.0 (75.2) |
31.1 (88.0) |
| Daily mean °C (°F) | 13.4 (56.1) |
14.8 (58.6) |
17.3 (63.1) |
20.4 (68.7) |
24.4 (75.9) |
28.2 (82.8) |
27.4 (81.3) |
26.8 (80.2) |
25.8 (78.4) |
21.3 (70.3) |
17.1 (62.8) |
13.2 (55.8) |
20.8 (69.4) |
| Mean daily minimum °C (°F) | 2.3 (36.1) |
3.4 (38.1) |
5.7 (42.3) |
8.5 (47.3) |
12.5 (54.5) |
18.2 (64.8) |
19.6 (67.3) |
19.1 (66.4) |
17.6 (63.7) |
11.5 (52.7) |
6.4 (43.5) |
2.4 (36.3) |
10.6 (51.1) |
| Record low °C (°F) | −7.0 (19.4) |
−4.0 (24.8) |
−5.0 (23.0) |
−1.0 (30.2) |
2.0 (35.6) |
10.0 (50.0) |
10.0 (50.0) |
7.0 (44.6) |
10.0 (50.0) |
0.9 (33.6) |
−4.0 (24.8) |
−4.0 (24.8) |
−7.0 (19.4) |
| Average precipitation mm (inches) | 41.2 (1.62) |
17.1 (0.67) |
10.0 (0.39) |
7.8 (0.31) |
9.4 (0.37) |
43.0 (1.69) |
108.5 (4.27) |
85.4 (3.36) |
52.1 (2.05) |
25.4 (1.00) |
9.3 (0.37) |
24.8 (0.98) |
434.0 (17.09) |
| Average precipitation days (≥ 0.1 mm) | 3.1 | 1.1 | 0.7 | 0.8 | 0.7 | 3.0 | 7.8 | 6.4 | 3.8 | 0.9 | 0.8 | 2.2 | 31.1 |
| Source: Servicio Metereológico Nacional (Average temperatures, 1981-2010 - Extreme temperatures, 1972-2014)[3] | |||||||||||||
References
- ↑ "Moris". Catálogo de Localidades. Secretaría de Desarrollo Social (SEDESOL). Retrieved 23 April 2014.
- ↑ Instituto Nacional de Estadística y Geografía. Principales resultados por localidad 2005 (ITER). Retrieved on October 25, 2008.
- ↑ "Normales Climatológicas para Moris (1981-2010)". Servicio Meteorológico Nacional. Retrieved 2 May 2017.
Chihuahua (capital) | ||
| Cities |  | |
| Municipalities | ||
| Metropolitan areas |
| |
| History | ||
| Sights | ||
| Other topics | ||
This article is issued from Wikipedia. The text is licensed under Creative Commons - Attribution - Sharealike. Additional terms may apply for the media files.