| ||||||||||||||||||||||||||
| ||||||||||||||||||||||||||


| ||||||||||||||||||||||||||
| ||||||||||||||||||||||||||
| Elections in Nebraska |
|---|
 |
|
|
The 2012 United States presidential election in Nebraska took place on November 6, 2012, as part of the 2012 United States presidential election in which all 50 states plus the District of Columbia participated. Voters chose five electors to represent them in the Electoral College via a popular vote pitting incumbent Democratic President Barack Obama and his running mate, Vice President Joe Biden, against Republican challenger and former Massachusetts Governor Mitt Romney and his running mate, Congressman Paul Ryan.
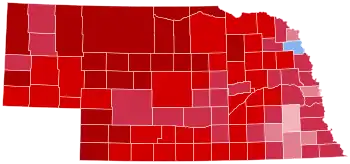
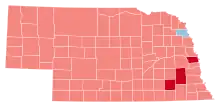
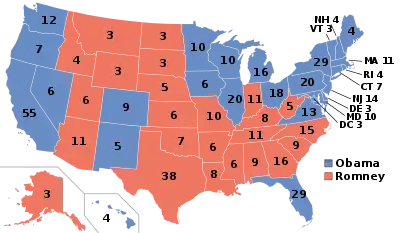
Mitt Romney carried Nebraska, taking 59.80% of the vote to Barack Obama's 38.03%, a margin of 21.77%. Nebraska is one of two states (along with Maine) which splits its electoral votes based on the winner in each congressional district. In 2012, Romney won all 3 congressional districts, thus winning all 5 of the state's electoral votes. This was a change from 2008, when the state as a whole had voted for Republican John McCain but Democrat Barack Obama still won an electoral vote from the state. Nebraska's 2nd congressional district, home to Omaha, had split with the rest of the state and awarded one of Nebraska's electoral votes to a Democratic presidential nominee for the first time since 1964. Nebraska's 2nd congressional district, Indiana, and North Carolina were the only sources of electoral votes won by Obama in 2008 that Romney managed to flip. Obama only won a single county, Thurston, largely due to its majority and increasingly politically active Native American population. He also narrowly lost three of four counties he won in 2008: Douglas, Lancaster, and Saline, home to the cities of Omaha, Lincoln, and Crete, respectively. He became the first Democrat since Grover Cleveland in 1892 to win without carrying Saline County.
As of the 2020 presidential election, this is the last time that the Democrat won Thurston County and the Republican won Douglas or Lancaster County. This is also the last election when both Nebraska's 2nd congressional district did not back the overall winner of the Electoral College (and the sole time that would occur since 2000) and while the Democratic candidate would win the general election without carrying the district.
Primary elections
Democratic primary
The Democratic primary was not held as Barack Obama ran unopposed and had secured enough delegates for nomination.[1]
Republican primary
| |||||||||||||||||||||||||||||||||||||||||
| |||||||||||||||||||||||||||||||||||||||||
 Nebraska results by county
Mitt Romney
(Note: Italicization indicates a withdrawn candidacy) | |||||||||||||||||||||||||||||||||||||||||
2012 U.S. presidential election | |
|---|---|
| Democratic Party | |
| Republican Party | |
| Related races | |
| |
The Republican primary was on May 15, 2012.[2] This primary was purely of an advisory nature. From June 1 to June 10 caucuses county conventions caucused to elect delegates to the state convention. These delegates were not bound to vote for any candidate, but at the state convention on July 14, elected 32 bound National delegates. 3 party leaders attended the National Convention unbound, making a total of 35 voting delegates going to the national convention from Nebraska.
| 2012 Nebraska Republican primary | |||
|---|---|---|---|
| Candidate | Votes | Percentage | Delegates |
| Mitt Romney | 131,436 | 70.89% | 30 |
| Rick Santorum | 25,830 | 13.93% | 0 |
| Ron Paul | 18,508 | 9.98% | 2 |
| Newt Gingrich | 9,628 | 5.19% | 0 |
| Unpledged delegates: | 3 | ||
| Total: | 185,402 | 100.0% | 35 |
| Key: | Withdrew prior to contest |
Convention
The State Convention was held in Grand Island on July 14, 2012.
| Convention Results[3][4] | |||||||||||||
|---|---|---|---|---|---|---|---|---|---|---|---|---|---|
| Candidate | 1st | 2nd | 3rd | State | Party leaders |
Total | |||||||
| 3 | 1 | 3 | 23 | 2 | 32 | ||||||||
| Ron Paul | 0 | 2 | 0 | 0 | 0 | 2 | |||||||
| Unknown | 0 | 0 | 0 | 0 | 1 | 1 | |||||||
| Total | 9 | 23 | 3 | 35 | |||||||||
General election
Results
| 2012 United States presidential election in Nebraska | ||||||
|---|---|---|---|---|---|---|
| Party | Candidate | Running mate | Votes | Percentage | Electoral votes | |
| Republican | Mitt Romney | Paul Ryan | 475,064 | 59.80% | 5 | |
| Democratic | Barack Obama | Joe Biden | 302,081 | 38.03% | 0 | |
| Libertarian | Gary Johnson | Jim Gray | 11,109 | 1.40% | 0 | |
| Write-Ins | 3,717 | 0.47% | 0 | |||
| Independent | Randall Terry | Missy Smith | 2,408 | 0.30% | 0 | |
| Totals | 794,379 | 100.00% | 5 | |||
By county
| County | Mitt Romney Republican |
Barack Obama Democratic |
Various candidates Other parties |
Margin | Total | ||||
|---|---|---|---|---|---|---|---|---|---|
| # | % | # | % | # | % | # | % | ||
| Adams | 8,316 | 65.64% | 4,062 | 32.06% | 292 | 2.30% | 4,254 | 33.58% | 12,670 |
| Antelope | 2,596 | 80.32% | 571 | 17.67% | 65 | 2.01% | 2,025 | 62.65% | 3,232 |
| Arthur | 227 | 86.64% | 30 | 11.45% | 5 | 1.91% | 197 | 75.19% | 262 |
| Banner | 346 | 84.18% | 55 | 13.38% | 10 | 2.44% | 291 | 70.80% | 411 |
| Blaine | 268 | 88.45% | 29 | 9.57% | 6 | 1.98% | 239 | 78.88% | 303 |
| Boone | 2,138 | 76.19% | 615 | 21.92% | 53 | 1.89% | 1,523 | 54.27% | 2,806 |
| Box Butte | 2,869 | 60.98% | 1,692 | 35.96% | 144 | 3.06% | 1,177 | 25.02% | 4,705 |
| Boyd | 873 | 81.51% | 188 | 17.55% | 10 | 0.94% | 685 | 63.96% | 1,071 |
| Brown | 1,302 | 83.73% | 224 | 14.41% | 29 | 1.86% | 1,078 | 69.32% | 1,555 |
| Buffalo | 13,570 | 69.76% | 5,365 | 27.58% | 518 | 2.66% | 8,205 | 42.18% | 19,453 |
| Burt | 2,029 | 60.12% | 1,291 | 38.25% | 55 | 1.63% | 738 | 21.87% | 3,375 |
| Butler | 2,738 | 70.95% | 1,045 | 27.08% | 76 | 1.97% | 1,693 | 43.87% | 3,859 |
| Cass | 7,556 | 62.04% | 4,367 | 35.85% | 257 | 2.11% | 3,189 | 26.19% | 12,180 |
| Cedar | 3,278 | 75.63% | 958 | 22.10% | 98 | 2.27% | 2,320 | 53.53% | 4,334 |
| Chase | 1,584 | 84.84% | 254 | 13.60% | 29 | 1.56% | 1,330 | 71.24% | 1,867 |
| Cherry | 2,557 | 83.45% | 436 | 14.23% | 71 | 2.32% | 2,121 | 69.22% | 3,064 |
| Cheyenne | 3,449 | 74.19% | 1,084 | 23.32% | 116 | 2.49% | 2,365 | 50.87% | 4,649 |
| Clay | 2,232 | 75.74% | 667 | 22.63% | 48 | 1.63% | 1,565 | 53.11% | 2,947 |
| Colfax | 2,051 | 66.83% | 969 | 31.57% | 49 | 1.60% | 1,082 | 35.26% | 3,069 |
| Cuming | 2,876 | 72.33% | 1,031 | 25.93% | 69 | 1.74% | 1,845 | 46.40% | 3,976 |
| Custer | 4,296 | 78.14% | 1,083 | 19.70% | 119 | 2.16% | 3,213 | 58.44% | 5,498 |
| Dakota | 3,094 | 50.42% | 2,922 | 47.62% | 120 | 1.96% | 172 | 2.80% | 6,136 |
| Dawes | 2,478 | 66.47% | 1,132 | 30.36% | 118 | 3.17% | 1,346 | 36.11% | 3,728 |
| Dawson | 5,460 | 69.47% | 2,199 | 27.98% | 200 | 2.55% | 3,261 | 41.49% | 7,859 |
| Deuel | 763 | 75.02% | 215 | 21.14% | 39 | 3.84% | 548 | 53.88% | 1,017 |
| Dixon | 1,745 | 64.97% | 870 | 32.39% | 71 | 2.64% | 875 | 32.58% | 2,686 |
| Dodge | 8,995 | 60.17% | 5,673 | 37.95% | 282 | 1.88% | 3,322 | 22.22% | 14,950 |
| Douglas | 113,220 | 50.56% | 106,456 | 47.54% | 4,251 | 1.90% | 6,764 | 3.02% | 223,927 |
| Dundy | 792 | 80.41% | 176 | 17.87% | 17 | 1.72% | 616 | 62.54% | 985 |
| Fillmore | 2,007 | 69.71% | 807 | 28.03% | 65 | 2.26% | 1,200 | 41.68% | 2,879 |
| Franklin | 1,112 | 72.40% | 384 | 25.00% | 40 | 2.60% | 728 | 47.40% | 1,536 |
| Frontier | 1,007 | 77.16% | 271 | 20.77% | 27 | 2.07% | 736 | 56.39% | 1,305 |
| Furnas | 1,782 | 79.55% | 423 | 18.88% | 35 | 1.57% | 1,359 | 60.67% | 2,240 |
| Gage | 5,513 | 57.06% | 3,903 | 40.40% | 245 | 2.54% | 1,610 | 16.66% | 9,661 |
| Garden | 829 | 75.99% | 242 | 22.18% | 20 | 1.83% | 587 | 53.81% | 1,091 |
| Garfield | 769 | 81.81% | 149 | 15.85% | 22 | 2.34% | 620 | 65.96% | 940 |
| Gosper | 734 | 75.05% | 230 | 23.52% | 14 | 1.43% | 504 | 51.53% | 978 |
| Grant | 322 | 88.71% | 30 | 8.26% | 11 | 3.03% | 292 | 80.45% | 363 |
| Greeley | 820 | 69.20% | 340 | 28.69% | 25 | 2.11% | 480 | 40.51% | 1,185 |
| Hall | 12,646 | 62.51% | 7,161 | 35.40% | 422 | 2.09% | 5,485 | 27.11% | 20,229 |
| Hamilton | 3,600 | 73.91% | 1,146 | 23.53% | 125 | 2.56% | 2,454 | 50.38% | 4,871 |
| Harlan | 1,395 | 78.46% | 354 | 19.91% | 29 | 1.63% | 1,041 | 58.55% | 1,778 |
| Hayes | 476 | 88.31% | 51 | 9.46% | 12 | 2.23% | 425 | 78.85% | 539 |
| Hitchcock | 1,178 | 78.80% | 274 | 18.33% | 43 | 2.87% | 904 | 60.47% | 1,495 |
| Holt | 3,922 | 79.41% | 882 | 17.86% | 135 | 2.73% | 3,040 | 61.55% | 4,939 |
| Hooker | 330 | 83.54% | 59 | 14.94% | 6 | 1.52% | 271 | 68.60% | 395 |
| Howard | 1,890 | 65.85% | 914 | 31.85% | 66 | 2.30% | 976 | 34.00% | 2,870 |
| Jefferson | 2,166 | 62.86% | 1,195 | 34.68% | 85 | 2.46% | 971 | 28.18% | 3,446 |
| Johnson | 1,225 | 59.38% | 790 | 38.29% | 48 | 2.33% | 435 | 21.09% | 2,063 |
| Kearney | 2,349 | 73.87% | 773 | 24.31% | 58 | 1.82% | 1,576 | 49.56% | 3,180 |
| Keith | 3,044 | 75.01% | 928 | 22.87% | 86 | 2.12% | 2,116 | 52.14% | 4,058 |
| Keya Paha | 393 | 81.20% | 80 | 16.53% | 11 | 2.27% | 313 | 64.67% | 484 |
| Kimball | 1,235 | 73.21% | 395 | 23.41% | 57 | 3.38% | 840 | 49.80% | 1,687 |
| Knox | 2,885 | 71.48% | 1,059 | 26.24% | 92 | 2.28% | 1,826 | 45.24% | 4,036 |
| Lancaster | 62,434 | 49.02% | 62,015 | 48.69% | 2,906 | 2.29% | 419 | 0.33% | 127,355 |
| Lincoln | 10,728 | 68.53% | 4,450 | 28.43% | 477 | 3.06% | 6,278 | 40.10% | 15,655 |
| Logan | 356 | 82.60% | 68 | 15.78% | 7 | 1.62% | 288 | 66.82% | 431 |
| Loup | 290 | 81.01% | 62 | 17.32% | 6 | 1.67% | 228 | 63.69% | 358 |
| Madison | 10,062 | 72.47% | 3,485 | 25.10% | 338 | 2.43% | 6,577 | 47.37% | 13,885 |
| McPherson | 237 | 81.44% | 41 | 14.09% | 13 | 4.47% | 196 | 67.35% | 291 |
| Merrick | 2,490 | 71.37% | 925 | 26.51% | 74 | 2.12% | 1,565 | 44.86% | 3,489 |
| Morrill | 1,681 | 76.76% | 455 | 20.78% | 54 | 2.46% | 1,226 | 55.98% | 2,190 |
| Nance | 1,106 | 68.23% | 481 | 29.67% | 34 | 2.10% | 625 | 38.56% | 1,621 |
| Nemaha | 2,012 | 62.60% | 1,128 | 35.10% | 74 | 2.30% | 884 | 27.50% | 3,214 |
| Nuckolls | 1,574 | 71.84% | 568 | 25.92% | 49 | 2.24% | 1,006 | 45.92% | 2,191 |
| Otoe | 4,258 | 60.99% | 2,561 | 36.68% | 163 | 2.33% | 1,697 | 24.31% | 6,982 |
| Pawnee | 899 | 67.04% | 400 | 29.83% | 42 | 3.13% | 499 | 37.21% | 1,341 |
| Perkins | 1,135 | 81.42% | 238 | 17.07% | 21 | 1.51% | 897 | 64.35% | 1,394 |
| Phelps | 3,400 | 77.63% | 880 | 20.09% | 100 | 2.28% | 2,520 | 57.54% | 4,380 |
| Pierce | 2,707 | 78.90% | 637 | 18.57% | 87 | 2.53% | 2,070 | 60.33% | 3,431 |
| Platte | 10,061 | 74.68% | 3,148 | 23.37% | 264 | 1.95% | 6,913 | 51.31% | 13,473 |
| Polk | 1,890 | 76.92% | 528 | 21.49% | 39 | 1.59% | 1,362 | 55.43% | 2,457 |
| Red Willow | 3,891 | 78.83% | 952 | 19.29% | 93 | 1.88% | 2,939 | 59.54% | 4,936 |
| Richardson | 2,443 | 65.34% | 1,191 | 31.85% | 105 | 2.81% | 1,252 | 33.49% | 3,739 |
| Rock | 672 | 85.17% | 103 | 13.05% | 14 | 1.78% | 569 | 72.12% | 789 |
| Saline | 2,557 | 51.57% | 2,289 | 46.17% | 112 | 2.26% | 268 | 5.40% | 4,958 |
| Sarpy | 43,213 | 60.45% | 26,671 | 37.31% | 1,606 | 2.24% | 16,542 | 23.14% | 71,490 |
| Saunders | 6,770 | 65.65% | 3,307 | 32.07% | 235 | 2.28% | 3,463 | 33.58% | 10,312 |
| Scotts Bluff | 9,648 | 67.53% | 4,327 | 30.29% | 312 | 2.18% | 5,321 | 37.24% | 14,287 |
| Seward | 5,003 | 66.06% | 2,386 | 31.51% | 184 | 2.43% | 2,617 | 34.55% | 7,573 |
| Sheridan | 2,021 | 81.76% | 390 | 15.78% | 61 | 2.46% | 1,631 | 65.98% | 2,472 |
| Sherman | 927 | 60.59% | 552 | 36.08% | 51 | 3.33% | 375 | 24.51% | 1,530 |
| Sioux | 624 | 84.44% | 101 | 13.67% | 14 | 1.89% | 523 | 70.77% | 739 |
| Stanton | 1,949 | 73.71% | 614 | 23.22% | 81 | 3.07% | 1,335 | 50.49% | 2,644 |
| Thayer | 1,874 | 70.48% | 728 | 27.38% | 57 | 2.14% | 1,146 | 43.10% | 2,659 |
| Thomas | 360 | 88.24% | 42 | 10.29% | 6 | 1.47% | 318 | 77.95% | 408 |
| Thurston | 939 | 42.39% | 1,247 | 56.30% | 29 | 1.31% | -308 | -13.91% | 2,215 |
| Valley | 1,657 | 75.49% | 498 | 22.69% | 40 | 1.82% | 1,159 | 52.80% | 2,195 |
| Washington | 6,899 | 67.33% | 3,132 | 30.57% | 215 | 2.10% | 3,767 | 36.76% | 10,246 |
| Wayne | 2,493 | 67.71% | 1,074 | 29.17% | 115 | 3.12% | 1,419 | 38.54% | 3,682 |
| Webster | 1,258 | 72.22% | 442 | 25.37% | 42 | 2.41% | 816 | 46.85% | 1,742 |
| Wheeler | 345 | 77.01% | 93 | 20.76% | 10 | 2.23% | 252 | 56.25% | 448 |
| York | 4,874 | 76.70% | 1,373 | 21.61% | 108 | 1.69% | 3,501 | 55.09% | 6,355 |
| Totals | 475,064 | 59.80% | 302,081 | 38.03% | 17,234 | 2.17% | 172,983 | 21.77% | 794,379 |

|
Democratic
Hold |
Republican
Hold
Gain from Democratic
|
Counties that flipped from Democratic to Republican
Results by congressional district
Romney won all three of Nebraska's congressional districts.[5]
| District | Romney % | Romney # | Obama % | Obama # | Johnson % | Johnson # | Terry % | Terry # | Representative |
|---|---|---|---|---|---|---|---|---|---|
| 1st | 57.43% | 152,021 | 40.83% | 108,082 | 1.45% | 3,847 | 0.28% | 762 | Jeff Fortenberry |
| 2nd | 52.85% | 140,976 | 45.70% | 121,889 | 1.27% | 3,393 | 0.18% | 469 | Lee Terry |
| 3rd | 70.23% | 182,067 | 27.82% | 72,110 | 1.44% | 3,869 | 0.45% | 1,177 | Adrian Smith |
See also
References
- ↑ "Nebraska Results". CNN. Retrieved November 7, 2012.
- ↑ "Archived copy" (PDF). Archived from the original (PDF) on November 8, 2018. Retrieved August 14, 2012.
{{cite web}}: CS1 maint: archived copy as title (link) - ↑ "Archived copy". Archived from the original on June 10, 2012. Retrieved July 19, 2012.
{{cite web}}: CS1 maint: archived copy as title (link) - ↑ "Nebraska Republican Delegation 2012".
- ↑ "Official Results of Nebraska General Election - November 6, 2012" (PDF). Retrieved April 16, 2013.
External links
- The Green Papers: for Nebraska
- The Green Papers: Major state elections in chronological order


.jpg.webp)
.jpg.webp)
