| |||||||||||||||||
| |||||||||||||||||
 County results Guinn: 60–70% 70–80% 80–90% | |||||||||||||||||
| |||||||||||||||||
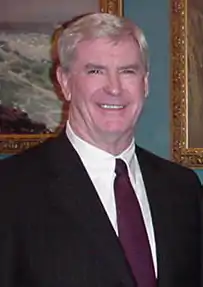

The 2002 Nevada gubernatorial election took place on November 5, 2002. Incumbent Republican Governor Kenny Guinn defeated Democratic nominee and Nevada Senator Joe Neal in a landslide to win a second term.
| Elections in Nevada |
|---|
 |
|
|
As of 2023, this was the most recent Nevada gubernatorial election in which both major party candidates are now deceased. This election was the first time since 1954 that an incumbent Republican Governor of Nevada was re-elected.
Democratic primary
Candidates
- Joe Neal, Nevada Senator and candidate in 1998
- Barbara Scott, public accountant
- Dan Meyer
- Christopher J. Petrella, veteran
Results
| Party | Candidate | Votes | % | |
|---|---|---|---|---|
| Democratic | Joe Neal | 31,805 | 35.75 | |
| Democratic | None of These Candidates | 21,875 | 24.59 | |
| Democratic | Barbara Scott | 18,974 | 21.33 | |
| Democratic | Dan Meyer | 11,403 | 12.82 | |
| Democratic | Christopher J. Petrella | 4,917 | 5.53 | |
| Total votes | 88,974 | 100.00 | ||
Republican primary
Candidates
- Kenny Guinn, incumbent Governor of Nevada
- Shirley Cook, retired court reporter
- Bruce Westcott, businessman
- Bill Hiett, rancher
- Stan Lusak, retired janitor and postal employee
- James K. Prevot
- Carlo Poliak, perennial candidate
Results
| Party | Candidate | Votes | % | |
|---|---|---|---|---|
| Republican | Kenny Guinn (inc.) | 97,367 | 82.88 | |
| Republican | Shirley Cook | 7,717 | 6.57 | |
| Republican | None of These Candidates | 7,195 | 6.12 | |
| Republican | Bruce Westcott | 2,507 | 2.13 | |
| Republican | Bill Hiett | 1,167 | 0.99 | |
| Republican | Stan Lusak | 566 | 0.48 | |
| Republican | James K. Prevot | 560 | 0.48 | |
| Republican | Carlo Poliak | 395 | 0.34 | |
| Total votes | 117,474 | 100.00 | ||
General election
Predictions
| Source | Ranking | As of |
|---|---|---|
| The Cook Political Report[2] | Safe R | October 31, 2002 |
| Sabato's Crystal Ball[3] | Safe R | November 4, 2002 |
Polling
| Poll source | Date(s) administered |
Sample size[lower-alpha 1] |
Margin of error |
Kenny Guinn (R) |
Joe Neal (D) |
Other / Undecided |
|---|---|---|---|---|---|---|
| SurveyUSA | October 27–29, 2002 | 523 (LV) | ± 4.4% | 63% | 28% | 9% |
Results
| Party | Candidate | Votes | % | ±% | |
|---|---|---|---|---|---|
| Republican | Kenny Guinn (inc.) | 344,001 | 68.24% | +16.61% | |
| Democratic | Joe Neal | 110,935 | 22.01% | -20.03% | |
| None of These Candidates | None of These Candidates | 23,674 | 4.70% | +1.78% | |
| Libertarian | Dick Geyer | 8,104 | 1.61% | -0.08% | |
| Independent American | David G. Holmgren | 7,047 | 1.40% | -0.33% | |
| Independent | Jerry L. Norton | 5,543 | 1.10% | ||
| Green | Charles Laws | 4,775 | 0.95% | ||
| Majority | 233,066 | 46.24% | +36.64% | ||
| Turnout | 504,079 | ||||
| Republican hold | Swing | ||||
Counties that flipped from Democratic to Republican
Notes
- ↑ Key:
A – all adults
RV – registered voters
LV – likely voters
V – unclear
References
- 1 2 "Elections Results: Official 2002 Primary Election Results". Retrieved April 2, 2013.
- ↑ "Governor Updated October 31, 2002 | The Cook Political Report". The Cook Political Report. October 31, 2002. Archived from the original on December 8, 2002. Retrieved September 18, 2018.
- ↑ "Governors Races". www.centerforpolitics.org. November 4, 2002. Archived from the original on December 12, 2002. Retrieved September 18, 2018.
- ↑ "Elections Results: Official 2002 General Election Results". Retrieved April 2, 2013.
This article is issued from Wikipedia. The text is licensed under Creative Commons - Attribution - Sharealike. Additional terms may apply for the media files.