 AEX index performance between 1986 and 2012 | |
| Foundation | 1986 |
|---|---|
| Operator | Nasdaq, Inc. |
| Exchanges | Stockholm Stock Exchange |
| Constituents | 30 |
| Type | Large cap |
| Weighting method | Capitalization-weighted |
The OMX Stockholm 30 (OMXS30) is a stock market index for the Stockholm Stock Exchange. It is a capitalization-weighted index of the 30 most-traded stock on the Nasdaq Stockholm stock exchange. The index started on 30 Sep 1986 with a base value of 125.[1]
Index composition
2021-11-01[2]
| Company | Symbol | Index weight (%) |
|---|---|---|
| ABB Ltd | ABB | 2.53 |
| Alfa Laval | ALFA | 2.72 |
| Assa Abloy B | ASSA B | 4.73 |
| Astra Zeneca | AZN | 3.12 |
| Atlas Copco A | ATCO A | 8.19 |
| Atlas Copco B | ATCO B | 3.22 |
| Autoliv Inc. SDB | ALIV SDB | 0.79 |
| Boliden | BOL | 1.49 |
| Electrolux B | ELUX B | 1.04 |
| Ericsson B | ERIC B | 5.08 |
| Essity B | ESSITY B | 3.19 |
| Evolution Gaming | EVO | 5.27 |
| Getinge B | GETI B | 1.76 |
| Hennes & Mauritz B | HM B | 4.27 |
| Hexagon AB | HEXA B | 5.99 |
| Investor B | INVE B | 6.49 |
| Kinnevik B | KINV B | 1.45 |
| Nordea Bank | NDA SE | 3.09 |
| Sandvik | SAND | 4.86 |
| Sinch | SINCH | 2.09 |
| SEB A | SEB A | 5.22 |
| Skanska B | SKA B | 1.56 |
| SKF B | SKF B | 1.51 |
| SCA B | SCA B | 1.57 |
| Svenska Handelsbanken A | SHB A | 3.4 |
| Swedbank A | SWED A | 3.74 |
| Swedish Match | SWMA | 2.09 |
| Tele2 B | TEL2 B | 1.44 |
| Telia Company | TELIA | 2.47 |
| Volvo B | VOLV B | 5.63 |
Contract Specifications
The OMX Stockholm Index trades on the NASDAQ Nordic Derivatives exchange (OMXFUT). the contract specifications are shown below:
| OMX Stockholm 30 Index (OMXS30C) | |
|---|---|
| Exchange: | OMXFUT |
| Sector: | Index |
| Tick Size: | 0.01 |
| Tick Value: | 0.25 SEK |
| Big Point Value (BPV): | 25 |
| Denomination: | SEK |
| Decimal Place: | 2 |
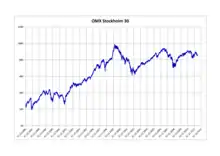
Annual returns
OMX Stockholm 30 Index 1986–2012 (log scale)
The following table shows the annual development of the OMX Stockholm 30 since 1986.[4][5]
| Year | Closing level | Change in index in points |
Change in index in % |
|---|---|---|---|
| 1986 | 126.18 | ||
| 1987 | 105.15 | −21.03 | −16.67 |
| 1988 | 159.63 | 54.48 | 51.81 |
| 1989 | 208.48 | 48.85 | 30.60 |
| 1990 | 150.33 | −58.15 | −27.89 |
| 1991 | 166.89 | 16.56 | 11.02 |
| 1992 | 179.64 | 12.75 | 7.64 |
| 1993 | 274.99 | 95.35 | 53.08 |
| 1994 | 284.40 | 9.41 | 3.42 |
| 1995 | 337.96 | 53.56 | 18.83 |
| 1996 | 469.29 | 131.33 | 38.86 |
| 1997 | 599.71 | 130.42 | 27.79 |
| 1998 | 701.31 | 101.60 | 16.94 |
| 1999 | 1,198.97 | 497.66 | 70.96 |
| 2000 | 1,056.11 | −142.86 | −11.92 |
| 2001 | 846.49 | −209.62 | −19.85 |
| 2002 | 493.20 | −353.29 | −41.74 |
| 2003 | 636.29 | 143.09 | 29.01 |
| 2004 | 741.88 | 105.59 | 16.59 |
| 2005 | 960.01 | 218.13 | 29.40 |
| 2006 | 1,147.27 | 187.26 | 19.51 |
| 2007 | 1,081.44 | −65.83 | −5.74 |
| 2008 | 662.33 | −419.11 | −38.75 |
| 2009 | 951.72 | 289.39 | 43.69 |
| 2010 | 1,155.57 | 203.85 | 21.42 |
| 2011 | 987.85 | −167.72 | −14.51 |
| 2012 | 1,104.73 | 116.88 | 11.83 |
| 2013 | 1,332.95 | 228.22 | 20.66 |
| 2014 | 1,464.55 | 131.60 | 9.87 |
| 2015 | 1,446.82 | −17.73 | −1.21 |
| 2016 | 1,517.20 | 70.38 | 4.86 |
| 2017 | 1,576.94 | 59.74 | 3.94 |
| 2018 | 1,408.74 | −168.20 | −10.67 |
| 2019 | 1,771.85 | 363.11 | 25.78 |
| 2020 | 1,874.74 | 102.89 | 5.80 |
| 2021 | 2,419.73 | 544.99 | 29.07 |
| 2022 | 2,043.40 | -376.33 | -15.55 |
Footnotes
- ↑ https://www.diva-portal.org/smash/get/diva2:925887/FULLTEXT01.pdf
- ↑ "Weightings values for DRBG - OMXS30.pdf" (PDF). nasdaq.com. NASDAQ. Retrieved 27 November 2021.
- ↑ "Historical Stockholm 30 Index Intraday Data (OMXS30C)". PortaraCQG. Retrieved 27 October 2022.
- ↑ "Historical data: OMX Stockholm 30 Index – Sweden (^OMXS)".
- ↑ "OMX Stockholm 30 Index (^OMX) Historical Data – Yahoo Finance". finance.yahoo.com. Retrieved 21 January 2020.
External links
Operator of the Nasdaq, Nasdaq Nordic, and Nasdaq Baltic stock exchange systems | ||
| Exchanges | ||
| Indexes | ||
| Other holdings | ||
This article is issued from Wikipedia. The text is licensed under Creative Commons - Attribution - Sharealike. Additional terms may apply for the media files.