| Pennsylvania's 3rd congressional district | |||
|---|---|---|---|
Interactive map of district boundaries since January 3, 2023 (Philadelphia outlined in red) | |||
| Representative |
| ||
| Distribution |
| ||
| Population (2022) | 772,128 | ||
| Median household income | $60,400 | ||
| Ethnicity |
| ||
| Cook PVI | D+39[1] | ||
Pennsylvania's third congressional district includes several areas of the city of Philadelphia, including West Philadelphia, most of Center City, and parts of North Philadelphia. It has been represented by Democrat Dwight Evans since 2019. With a Cook Partisan Voting Index rating of D+39, it is the most Democratic district in Pennsylvania.[1]
Prior to 2018, the district was located in the northwestern part of the state and included the cities of Erie, Sharon, Hermitage, Butler and Meadville. The Supreme Court of Pennsylvania redrew this district in February 2018 after ruling the previous map unconstitutional. The new third district is similar to the old second district and was heavily Democratic for the 2018 election and representation thereafter.[2] Dwight Evans, the incumbent from the old 2nd district, ran for re-election in the new 3rd District.
The current version of the 3rd, like the old 2nd, is a heavily Democratic, black-majority district. In 2020, the district gave Joe Biden 91 percent of the vote, his best showing in the nation.[3]
Recent statewide election results
| Year | Office | Result |
|---|---|---|
| 2020 | President | Biden 91–8% |
| 2022 | Governor | Shapiro 92–6% |
| 2022 | Senate | Fetterman 91–8% |
History
From 1983 to 2003, the district was located in Northeast Pennsylvania and was represented by Rep. Robert Borski; much of that district was merged with the 13th district after the 2000 census, while the 3rd was reconfigured to take in most of the territory in the old 21st district. This version of the 3rd supported President George W. Bush in 2004 as well as John McCain in 2008, Mitt Romney in 2012 and Donald Trump in 2016.
List of members representing the district
The district was organized from Pennsylvania's at-large congressional district in 1791
1791–1793: one seat
| Cong ress |
Representative | Party | Years | Electoral history | |
|---|---|---|---|---|---|
| District first established March 4, 1791 | |||||
| 2nd | Israel Jacobs (Providence Township) |
Pro-Administration | March 4, 1791 – March 3, 1793 |
Elected in 1791. Redistricted to the at-large district and lost re-election. | |
1795–1823: one seat, then three, then two
The district was organized from Pennsylvania's at-large congressional district in 1795. Two additional seats were added in 1803, elected on a general ticket. One of those seats was eliminated in 1813.
1823–present: one seat
The district was reorganized in 1823 to have one seat.
Recent elections
| Party | Candidate | Votes | % | |
|---|---|---|---|---|
| Democratic | Robert A. Borski Jr. (incumbent) | 130,528 | 68.8% | |
| Republican | Charles F. Dougherty | 59,343 | 31.3% | |
| Total votes | 189,871 | 100.0% | ||
| Democratic hold | ||||
| Party | Candidate | Votes | % | |
|---|---|---|---|---|
| Republican | Phil English | 116,763 | 77.7% | |
| Green | Anndrea M. Benson | 33,554 | 22.3% | |
| Total votes | 150,317 | 100.0% | ||
| Republican hold | ||||
| Party | Candidate | Votes | % | |
|---|---|---|---|---|
| Republican | Phil English (incumbent) | 166,580 | 60.1% | |
| Democratic | Steven Porter | 110,684 | 39.9% | |
| Total votes | 277,264 | 100.0% | ||
| Republican hold | ||||
| Party | Candidate | Votes | % | |
|---|---|---|---|---|
| Republican | Phil English (incumbent) | 108,525 | 53.6% | |
| Democratic | Steven Porter | 85,110 | 42.1% | |
| Constitution | Timothy Hagberg | 8,706 | 4.3% | |
| Total votes | 202,341 | 100.0% | ||
| Republican hold | ||||
| Party | Candidate | Votes | % | |
|---|---|---|---|---|
| Democratic | Kathy Dahlkemper | 146,846 | 51.2% | |
| Republican | Phil English (incumbent) | 139,757 | 48.8% | |
| Total votes | 286,603 | 100.0% | ||
| Democratic gain from Republican | ||||
| Party | Candidate | Votes | % | |
|---|---|---|---|---|
| Republican | Mike Kelly | 109,909 | 55.7% | |
| Democratic | Kathy Dahlkemper (incumbent) | 88,924 | 44.3% | |
| Total votes | 197,320 | 100.0% | ||
| Republican gain from Democratic | ||||
| Party | Candidate | Votes | % | |
|---|---|---|---|---|
| Republican | Mike Kelly (incumbent) | 165,826 | 54.82% | |
| Democratic | Missa Eaton | 123,933 | 40.97% | |
| Independent | Steven Porter | 12,755 | 4.22% | |
| Total votes | 302,514 | 100.0% | ||
| Republican hold | ||||
| Party | Candidate | Votes | % | |
|---|---|---|---|---|
| Republican | Mike Kelly (incumbent) | 113,859 | 60.63% | |
| Democratic | Daniel Lavallee | 73,931 | 39.37% | |
| Total votes | 187,790 | 100.0% | ||
| Republican hold | ||||
| Party | Candidate | Votes | % | |
|---|---|---|---|---|
| Republican | Mike Kelly (incumbent) | 244,893 | 100% | |
| Total votes | 244,893 | 100.0% | ||
| Republican hold | ||||
| Party | Candidate | Votes | % | |
|---|---|---|---|---|
| Democratic | Dwight Evans | 287,610 | 93.4% | |
| Republican | Bryan E. Leib | 20,387 | 6.6% | |
| Total votes | 307,997 | 100.0% | ||
| Democratic hold | ||||
| Party | Candidate | Votes | % | |
|---|---|---|---|---|
| Democratic | Dwight Evans (incumbent) | 341,708 | 91.0 | |
| Republican | Michael Harvey | 33,671 | 9.0 | |
| Total votes | 375,379 | 100.0 | ||
| Democratic hold | ||||
| Party | Candidate | Votes | % | |
|---|---|---|---|---|
| Democratic | Dwight Evans (incumbent) | 251,115 | 95.1 | |
| Socialist Workers | Christopher Hoeppner | 12,820 | 4.9 | |
| Total votes | 263,935 | 100.0 | ||
| Democratic hold | ||||
Historical district boundaries
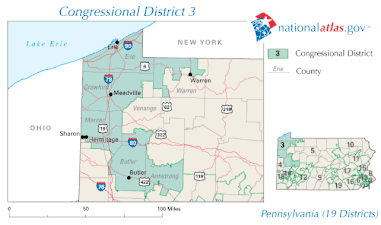 2003–2013
.tif.png.webp) 2013–2019
2013–2019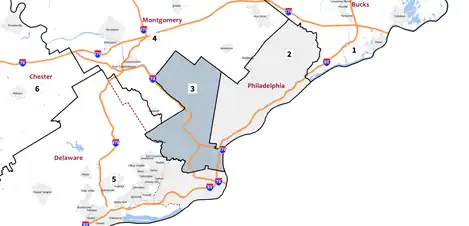 2019–2023
See also
References
- 1 2 "2022 Cook PVI: District Map and List". Cook Political Report. Retrieved January 10, 2023.
- ↑ Cohn, Nate; Bloch, Matthew; Quealy, Kevin (February 19, 2018). "The New Pennsylvania House Districts Are In. We Review the Mapmakers' Choices". The Upshot. The New York Times. Retrieved February 20, 2018.
- ↑ David Nir (February 19, 2021). "With polarization at a peak, the number of House 'crossover districts' is at its lowest in a century". Daily Kos.
- ↑ "2000 General Election". Elections Information. Pennsylvania Department of State. November 7, 2000. Archived from the original on January 30, 2012. Retrieved October 21, 2010.
- ↑ "2002 General Election". Elections Information. Pennsylvania Department of State. November 5, 2002. Archived from the original on October 30, 2008. Retrieved October 21, 2010.
- ↑ "2004 General Election". Elections Information. Pennsylvania Department of State. November 2, 2004. Archived from the original on May 22, 2008. Retrieved October 21, 2010.
- ↑ "2006 General Election". Elections Information. Pennsylvania Department of State. November 7, 2006. Archived from the original on November 27, 2008. Retrieved October 21, 2010.
- ↑ "2008 General Election". Elections Information. Pennsylvania Department of State. November 4, 2008. Archived from the original on December 8, 2008. Retrieved October 21, 2010.
- ↑ "2010 General Election". Elections Information. Pennsylvania Department of State. November 2, 2010. Archived from the original on November 6, 2010. Retrieved December 29, 2010.
- ↑ "2012 General Election". Elections Information. Pennsylvania Department of State. November 6, 2008. Retrieved May 29, 2015.
- ↑ "2014 General Election". Elections Information. Pennsylvania Department of State. November 4, 2008. Archived from the original on February 15, 2015. Retrieved May 29, 2015.
- Martis, Kenneth C. (1989). The Historical Atlas of Political Parties in the United States Congress. New York: Macmillan Publishing Company.
- Martis, Kenneth C. (1982). The Historical Atlas of United States Congressional Districts. New York: Macmillan Publishing Company.
- Congressional Biographical Directory of the United States 1774–present
.svg.png.webp)
_-_Colonel_Richard_Thomas.jpg.webp)

.jpg.webp)


_in_1916.jpg.webp)



.jpg.webp)

